Matplotlib是Python中的一個庫,它是數字的-NumPy庫的數學擴展。它是Python中令人驚歎的可視化庫,用於數組的2D圖,並用於與更廣泛的SciPy堆棧配合使用。
Matplotlib.axis.XAxis.get_figure()函數
matplotlib庫的axis模塊中的XAxis.get_figure()函數用於獲取藝術家所屬的Figure實例。
用法: XAxis.get_figure(self)
參數:此方法不接受任何參數。
返回值:此方法返回藝術家所屬的Figure實例。
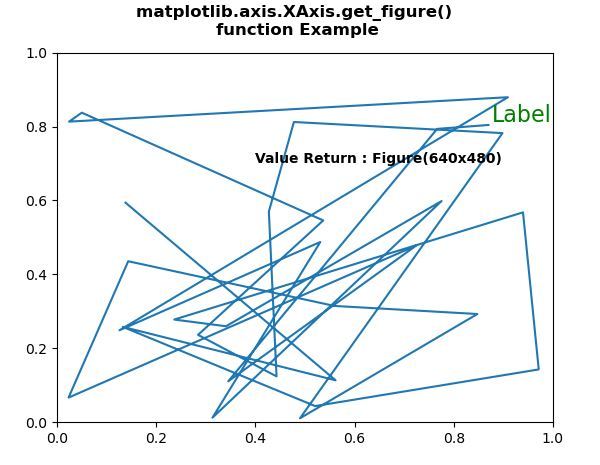
範例1:
# Implementation of matplotlib function
from matplotlib.axis import XAxis
import numpy as np
import matplotlib.pyplot as plt
import matplotlib.lines as lines
import matplotlib.transforms as mtransforms
import matplotlib.text as mtext


class GFGfun(lines.Line2D):

    def __init__(self, *args, **kwargs):
        self.text = mtext.Text(0, 0, '')
        lines.Line2D.__init__(self, *args, **kwargs)
        self.text.set_text(self.get_label())

    def set_figure(self, figure):
        self.text.set_figure(figure)
        lines.Line2D.set_figure(self, figure)

    def set_axes(self, axes):
        self.text.set_axes(axes)
        lines.Line2D.set_axes(self, axes)

    def set_transform(self, transform):
        # 2 pixel offset
        texttrans = transform + mtransforms.Affine2D().translate(3, 3)
        self.text.set_transform(texttrans)
        lines.Line2D.set_transform(self, transform)

    def set_data(self, x, y):
        if len(x):
            self.text.set_position((x[-1], y[-1]))

        lines.Line2D.set_data(self, x, y)

    def draw(self, renderer):
        lines.Line2D.draw(self, renderer)
        self.text.draw(renderer)


np.random.seed(10**7)

fig, ax = plt.subplots()
x, y = np.random.rand(2, 30)
line = GFGfun(x, y, mfc ='green',
            ms = 12,
            label ='Label')

line.text.set_color('green')
line.text.set_fontsize(16)

ax.add_line(line)

ax.text(0.4, 0.7, "Value Return:"
        +str(XAxis.get_figure(ax)),
        fontweight ="bold")

fig.suptitle("""matplotlib.axis.XAxis.get_figure()
function Example\n""", fontweight ="bold")

plt.show()
輸出:
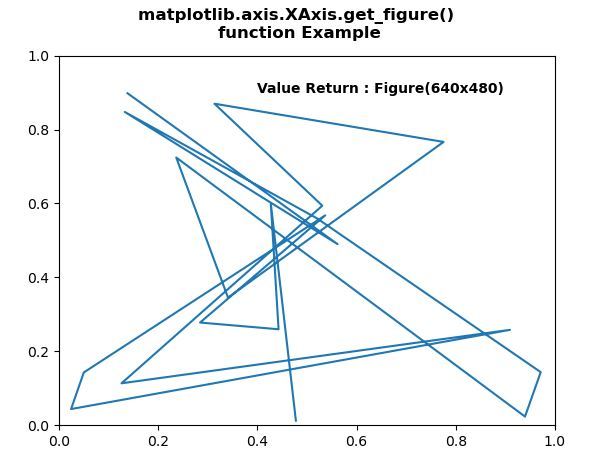
範例2:
# Implementation of matplotlib function
from matplotlib.axis import XAxis
import numpy as np
import matplotlib.pyplot as plt
import matplotlib.lines as lines
import matplotlib.transforms as mtransforms
import matplotlib.text as mtext


class GFGfun(lines.Line2D):

    def __init__(self, *args, **kwargs):
        self.text = mtext.Text(0, 0, '')
        lines.Line2D.__init__(self, *args, **kwargs)
        self.text.set_text(self.get_label())

    def set_figure(self, figure):
        self.text.set_figure(figure)
        lines.Line2D.set_figure(self, figure)


np.random.seed(10**7)


fig, ax = plt.subplots()
x, y = np.random.rand(2, 20)
line = GFGfun(x, y,
            mfc ='green', ms = 14, label ='Label')

line.text.set_color('green')
line.text.set_fontsize(17)

ax.add_line(line)

ax.text(0.4, 0.9, "Value Return:"
        +str(XAxis.get_figure(ax)),
        fontweight ="bold")

fig.suptitle("""matplotlib.axis.XAxis.get_figure()
function Example\n""", fontweight ="bold")

plt.show()
輸出:
相關用法
- Python Wand function()用法及代碼示例
- Python int()用法及代碼示例
- Python tell()用法及代碼示例
- Python map()用法及代碼示例
- Python str()用法及代碼示例
- Python dir()用法及代碼示例
- Python id()用法及代碼示例
- Python hex()用法及代碼示例
- Python now()用法及代碼示例
- Python sum()用法及代碼示例
- Python oct()用法及代碼示例
- Python ord()用法及代碼示例
- Python cmp()用法及代碼示例
- Python join()用法及代碼示例
- Python fsum()用法及代碼示例
- Python strftime()用法及代碼示例
- Python isdisjoint()用法及代碼示例
注:本文由純淨天空篩選整理自shivanisinghss2110大神的英文原創作品 Matplotlib.axis.XAxis.get_figure() function in Python。非經特殊聲明,原始代碼版權歸原作者所有,本譯文未經允許或授權,請勿轉載或複製。