Matplotlib是Python中的一個庫,它是數字的-NumPy庫的數學擴展。它是Python中令人驚歎的可視化庫,用於數組的2D圖,並用於與更廣泛的SciPy堆棧配合使用。
Matplotlib.axis.Tick.update()函數
matplotlib庫的axis模塊中的Tick.update()函數用於通過字典道具更新該藝術家的屬性。
用法: Tick.update(self, props)
參數:此方法接受以下參數。
- props:此參數是屬性的字典。
返回值:此方法不返回任何值。
以下示例說明了matplotlib.axis中的matplotlib.axis.Tick.update()函數:
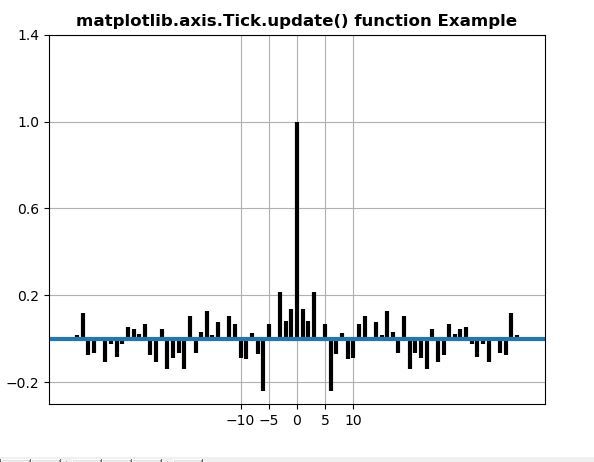
範例1:
Python3
# Implementation of matplotlib function
from matplotlib.axis import Tick
import matplotlib.pyplot as plt
import numpy as np


np.random.seed(10**7)
geeks = np.random.randn(100)

fig, ax = plt.subplots()
ax.acorr(geeks, usevlines = True,
         normed = True,
         maxlags = 40, lw = 3)

ax.grid(True)

prop = {'xticks':np.array([-10., -5.,
                            0., 5., 10.]),
        'yticks':np.array([-0.2,  0.2,
                            0.6, 1., 1.4]),
        'ylabel':None, 'xlabel':None}

Tick.update(ax, prop)

ax.set_title('matplotlib.axis.Tick.update() \
function Example', fontweight ="bold")

plt.show()
輸出:
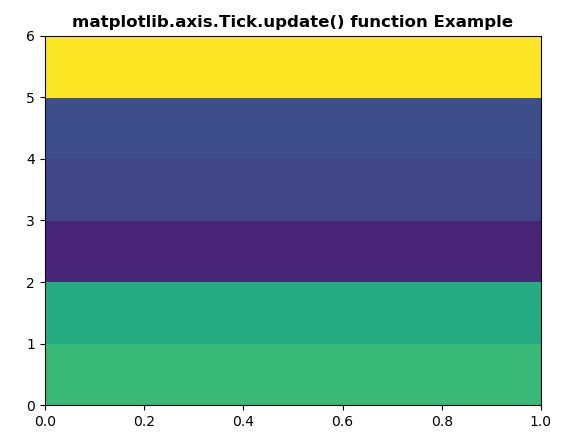
範例2:
Python3
# Implementation of matplotlib function
from matplotlib.axis import Tick
import numpy as np
import matplotlib.pyplot as plt


xx = np.random.rand(6, 5)

fig, ax = plt.subplots()

m = ax.pcolor(xx)
m.set_zorder(-20)
prop = {'autoscalex_on':False}

Tick.update(ax, prop)

ax.set_title('matplotlib.axis.Tick.update() \
function Example', fontweight ="bold")

plt.show()
輸出:
相關用法
- Python Wand function()用法及代碼示例
- Python int()用法及代碼示例
- Python tell()用法及代碼示例
- Python map()用法及代碼示例
- Python str()用法及代碼示例
- Python dir()用法及代碼示例
- Python id()用法及代碼示例
- Python hex()用法及代碼示例
- Python now()用法及代碼示例
- Python sum()用法及代碼示例
- Python oct()用法及代碼示例
- Python ord()用法及代碼示例
- Python cmp()用法及代碼示例
- Python join()用法及代碼示例
- Python fsum()用法及代碼示例
- Python strftime()用法及代碼示例
- Python isdisjoint()用法及代碼示例
注:本文由純淨天空篩選整理自SHUBHAMSINGH10大神的英文原創作品 Matplotlib.axis.Tick.update() function in Python。非經特殊聲明,原始代碼版權歸原作者所有,本譯文未經允許或授權,請勿轉載或複製。