Matplotlib是Python中的一個庫,它是數字的-NumPy庫的數學擴展。它是Python中令人驚歎的可視化庫,用於數組的2D圖,並用於與更廣泛的SciPy堆棧配合使用。
Matplotlib.axis.Tick.set_url()函數
matplotlib庫的axis模塊中的Tick.set_url()函數用於設置藝術家的URL。
用法: Tick.set_url(self, url)
參數:此方法接受以下參數。
- url:此參數是包含URL的字符串。
返回值:此方法不返回任何值。
以下示例說明了matplotlib.axis中的matplotlib.axis.Tick.set_url()函數:
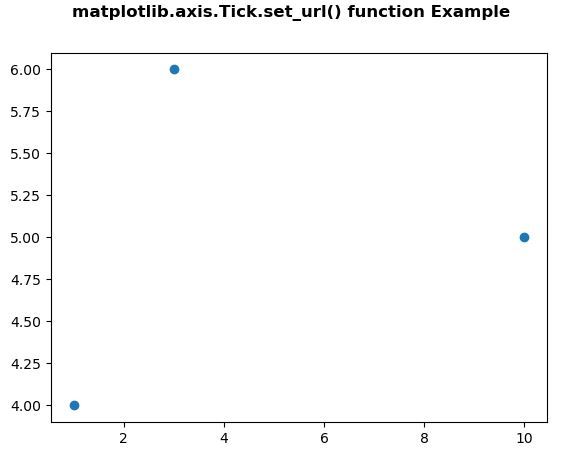
範例1:
Python3
# Implementation of matplotlib function
from matplotlib.axis import Tick
import numpy as np
import matplotlib.pyplot as plt

fig, ax = plt.subplots()
s = ax.scatter([1, 10, 3], [4, 5, 6])

Tick.set_url(s, 'http://www.google.com')
fig.canvas.print_figure('geeks1.svg')

fig.suptitle('matplotlib.axis.Tick.set_url() \
function Example', fontweight ="bold")

plt.show()
輸出:
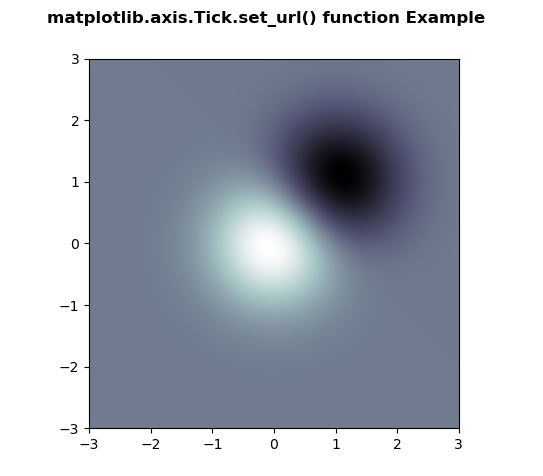
範例2:
Python3
# Implementation of matplotlib function
from matplotlib.axis import Tick
import numpy as np
import matplotlib.pyplot as plt

fig, ax = plt.subplots()
delta = 0.025

x = y = np.arange(-3.0, 3.0, delta)
X, Y = np.meshgrid(x, y)

Z1 = np.exp(-X**2 - Y**2)
Z2 = np.exp(-(X - 1)**2 - (Y - 1)**2)
Z = (Z1 - Z2) * 2

im = ax.imshow(Z,
               interpolation ='bilinear',
               cmap = "bone",
               origin ='lower',
               extent =[-3, 3, -3, 3])

Tick.set_url(im, 'http://www.google.com')
fig.canvas.print_figure('geeks2.svg')

fig.suptitle('matplotlib.axis.Tick.set_url() \
function Example', fontweight ="bold")

plt.show()
輸出:
相關用法
- Python Wand function()用法及代碼示例
- Python int()用法及代碼示例
- Python tell()用法及代碼示例
- Python map()用法及代碼示例
- Python str()用法及代碼示例
- Python dir()用法及代碼示例
- Python id()用法及代碼示例
- Python hex()用法及代碼示例
- Python now()用法及代碼示例
- Python sum()用法及代碼示例
- Python oct()用法及代碼示例
- Python ord()用法及代碼示例
- Python cmp()用法及代碼示例
- Python join()用法及代碼示例
- Python fsum()用法及代碼示例
- Python strftime()用法及代碼示例
- Python isdisjoint()用法及代碼示例
注:本文由純淨天空篩選整理自SHUBHAMSINGH10大神的英文原創作品 Matplotlib.axis.Tick.set_url() function in Python。非經特殊聲明,原始代碼版權歸原作者所有,本譯文未經允許或授權,請勿轉載或複製。