Matplotlib是Python中的一個庫,它是數字的-NumPy庫的數學擴展。它是Python中令人驚歎的可視化庫,用於數組的2D圖,並用於與更廣泛的SciPy堆棧配合使用。
Matplotlib.axis.Tick.set_sketch_params()函數
matplotlib庫的軸模塊中的Tick.set_sketch_params()函數用於設置草圖參數。
用法: Tick.set_sketch_params(self, scale=None, length=None, randomness=None)
參數: This method accepts the following parameters.
- 規模:此參數是垂直於源極線的擺動幅度,以像素為單位。
- 長度:此參數是沿線擺動的長度,以像素為單位。
- 隨機性:此參數是縮小或擴展長度的比例因子。
返回值:此方法不返回任何值。
以下示例說明了matplotlib.axis中的matplotlib.axis.Tick.set_sketch_params()函數:
範例1:
Python3
# Implementation of matplotlib function
from matplotlib.axis import Tick
import matplotlib.pyplot as plt
import matplotlib.colors as mcolors
import matplotlib.gridspec as gridspec
import numpy as np


plt.rcParams['savefig.facecolor'] = "0.8"
plt.rcParams['figure.figsize'] = 6, 5

fig, ax = plt.subplots()

ax.plot([1, 2, 3, 4, 5] , [2, 3,6,2,5])

ax.locator_params("x", nbins = 3)
ax.locator_params("y", nbins = 5)

ax.set_xlabel('x-label')
ax.set_ylabel('y-label')

Tick.set_sketch_params(ax, 50, 50, 10)

fig.suptitle('matplotlib.axis.Tick.set_sketch_params() \
function Example', fontweight ="bold")

plt.show()
輸出:

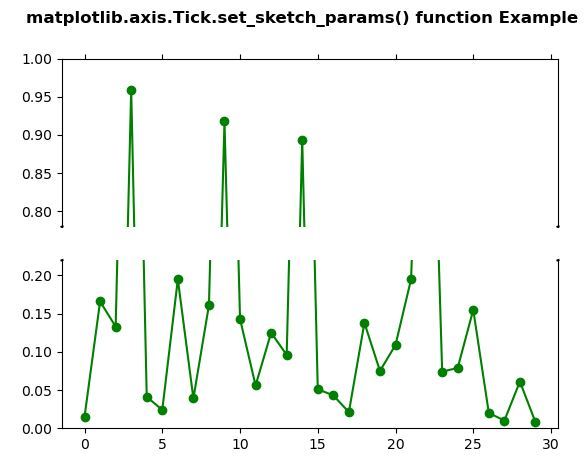
範例2:
Python3
# Implementation of matplotlib function
from matplotlib.axis import Tick
import matplotlib.pyplot as plt
import numpy as np

values = np.array([
    0.015, 0.166, 0.133,
    0.159, 0.041, 0.024,
    0.195, 0.039, 0.161,
    0.918, 0.143, 0.056,
    0.125, 0.096, 0.094,
    0.051, 0.043, 0.021,
    0.138, 0.075, 0.109,
    0.195, 0.750, 0.074,
    0.079, 0.155, 0.020,
    0.010, 0.061, 0.008])

values[[3, 14]] += .8

fig, (ax, ax2) = plt.subplots(2, 1, sharex = True)

ax.plot(values, "o-", color ="green")
ax2.plot(values, "o-", color ="green")

ax.set_ylim(.78, 1.)
ax2.set_ylim(0, .22)

ax.spines['bottom'].set_visible(False)
ax2.spines['top'].set_visible(False)
ax.xaxis.tick_top()
ax.tick_params(labeltop = False)
ax2.xaxis.tick_bottom()

d = .001
kwargs = dict(transform = ax.transAxes,
              color ='k', clip_on = False)

ax.plot((-d, +d), (-d, +d), **kwargs)
ax.plot((1 - d, 1 + d), (-d, +d), **kwargs)

kwargs.update(transform = ax2.transAxes)

ax2.plot((-d, +d), (1 - d, 1 + d), **kwargs)
ax2.plot((1 - d, 1 + d), (1 - d, 1 + d), **kwargs)

Tick.set_sketch_params(ax, 1.0, 10.0, 25.0)
Tick.set_sketch_params(ax2, 2.0, 100.0, 50.0)

fig.suptitle('matplotlib.axis.Tick.set_sketch_params() \
function Example', fontweight ="bold")

plt.show()
輸出:
相關用法
- Python Wand function()用法及代碼示例
- Python cmp()用法及代碼示例
- Python oct()用法及代碼示例
- Python hex()用法及代碼示例
- Python map()用法及代碼示例
- Python ord()用法及代碼示例
- Python tell()用法及代碼示例
- Python sum()用法及代碼示例
- Python id()用法及代碼示例
- Python str()用法及代碼示例
- Python int()用法及代碼示例
- Python now()用法及代碼示例
- Python dir()用法及代碼示例
- Python fsum()用法及代碼示例
- Python seek()用法及代碼示例
- Python bytearray()用法及代碼示例
注:本文由純淨天空篩選整理自SHUBHAMSINGH10大神的英文原創作品 Matplotlib.axis.Tick.set_sketch_params() function in Python。非經特殊聲明,原始代碼版權歸原作者所有,本譯文未經允許或授權,請勿轉載或複製。