Matplotlib是Python中的一個庫,它是數字的-NumPy庫的數學擴展。它是Python中令人驚歎的可視化庫,用於數組的2D圖,並用於與更廣泛的SciPy堆棧配合使用。
Matplotlib.axis.Tick.set_clip_box()函數
matplotlib庫的軸模塊中的Tick.set_clip_box()函數用於設置藝術家的剪輯Bbox。
用法: Tick.set_clip_box(self, clipbox)
參數:此方法接受以下參數。
- clipbox:此參數是Bbox。
返回值:此方法不返回任何值。
以下示例說明了matplotlib.axis中的matplotlib.axis.Tick.set_clip_box()函數:
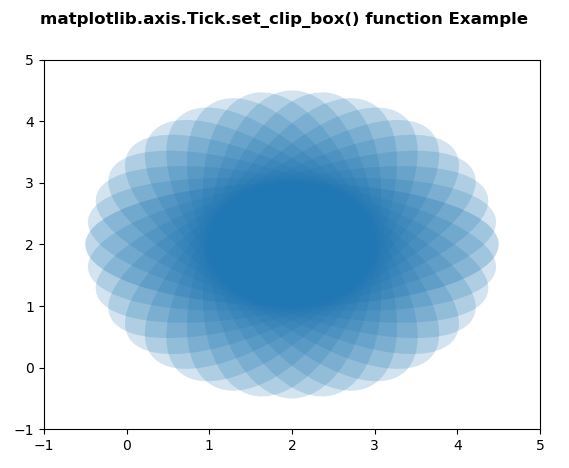
範例1:
Python3
# Implementation of matplotlib function
from matplotlib.axis import Tick
import matplotlib.pyplot as plt
import numpy as np
from matplotlib.patches import Ellipse


delta = 10.0

angles = np.arange(0, 360 + delta, delta)
ells = [Ellipse((2, 2), 5, 2, a) for a in angles]

fig, ax = plt.subplots()

for e in ells:
    Tick.set_clip_box(e, ax.bbox)
    e.set_alpha(0.1)
    ax.add_artist(e)

plt.xlim(-1, 5)
plt.ylim(-1, 5)

fig.suptitle('matplotlib.axis.Tick.set_clip_box() \
function Example', fontweight ="bold")

plt.show()
=
輸出:
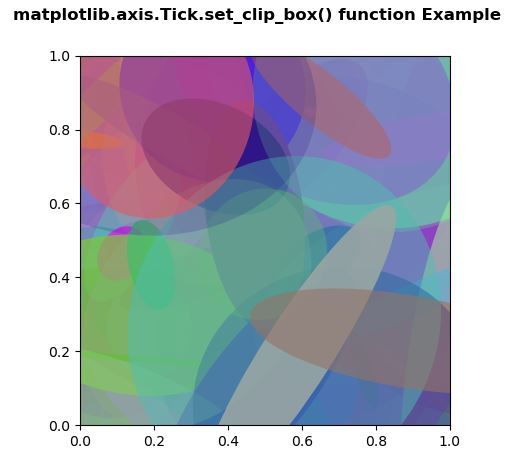
範例2:
Python3
# Implementation of matplotlib function
from matplotlib.axis import Tick
import matplotlib.pyplot as plt
import numpy as np
from matplotlib.patches import Ellipse


NUM = 200

ells = [Ellipse(xy = np.random.rand(2),
                width = np.random.rand(),
                height = np.random.rand(),
                angle = np.random.rand() * 360)
        for i in range(NUM)]

fig, ax = plt.subplots(subplot_kw ={'aspect':'equal'})

for e in ells:
    ax.add_artist(e)
    Tick.set_clip_box(e, ax.bbox)
    e.set_clip_box(ax.bbox)
    e.set_alpha(np.random.rand())
    e.set_facecolor(np.random.rand(4))

fig.suptitle('matplotlib.axis.Tick.set_clip_box() \
function Example', fontweight ="bold")

plt.show()
輸出:
相關用法
- Python Wand function()用法及代碼示例
- Python int()用法及代碼示例
- Python tell()用法及代碼示例
- Python map()用法及代碼示例
- Python str()用法及代碼示例
- Python dir()用法及代碼示例
- Python id()用法及代碼示例
- Python hex()用法及代碼示例
- Python now()用法及代碼示例
- Python sum()用法及代碼示例
- Python oct()用法及代碼示例
- Python ord()用法及代碼示例
- Python cmp()用法及代碼示例
- Python join()用法及代碼示例
- Python fsum()用法及代碼示例
- Python strftime()用法及代碼示例
- Python isdisjoint()用法及代碼示例
注:本文由純淨天空篩選整理自SHUBHAMSINGH10大神的英文原創作品 Matplotlib.axis.Tick.set_clip_box() function in Python。非經特殊聲明,原始代碼版權歸原作者所有,本譯文未經允許或授權,請勿轉載或複製。