Matplotlib是Python中的一個庫,它是數字的-NumPy庫的數學擴展。它是Python中令人驚歎的可視化庫,用於數組的2D圖,並用於與更廣泛的SciPy堆棧配合使用。
matplotlib.axis.Tick.set()函數
matplotlib庫的軸模塊中的Tick.set()函數是屬性批處理設置程序。傳遞kwarg設置屬性。
用法: Tick.set(self, **kwargs)
參數:此方法不接受除** kwargs之外的任何參數。
返回值:此方法不返回任何值。
以下示例說明了matplotlib.axis中的matplotlib.axis.Tick.set()函數:
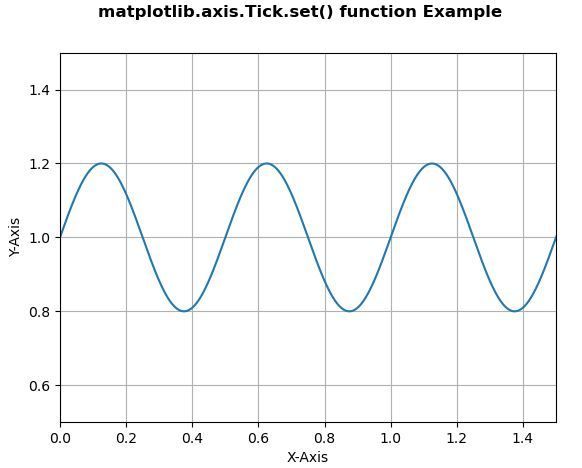
範例1:
Python3
# Implementation of matplotlib function
from matplotlib.axis import Tick
import matplotlib
import matplotlib.pyplot as plt
import numpy as np


t = np.arange(0.0, 2, 0.001)
s = 1 + np.sin(4 * np.pi * t)*0.2

fig, ax = plt.subplots()
ax.plot(t, s)

Tick.set(ax, xlabel ='X-Axis', ylabel ='Y-Axis',
    xlim =(0, 1.5), ylim =(0.5, 1.5))

ax.grid()

fig.suptitle('matplotlib.axis.Tick.set() \
function Example', fontweight ="bold")

plt.show()
輸出:
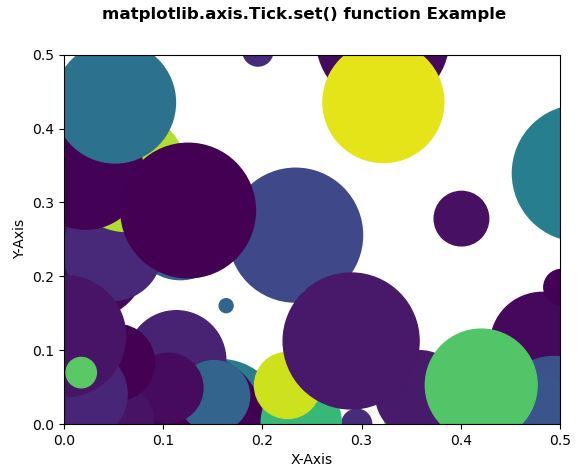
範例2:
Python3
# Implementation of matplotlib function
from matplotlib.axis import Tick
import numpy as np
import matplotlib.pyplot as plt
np.random.seed(19680801)


fig, ax = plt.subplots()

x, y, s, c = np.random.rand(4, 100)
s *= 10000

ax.scatter(x**2, y**2, s, c**2)

Tick.set(ax, xlabel ='X-Axis', ylabel ='Y-Axis',
   xlim =(0, 0.5), ylim =(0, 0.5))


fig.suptitle('matplotlib.axis.Tick.set() \
function Example', fontweight ="bold")

plt.show()
輸出:
相關用法
- Python Wand function()用法及代碼示例
- Python now()用法及代碼示例
- Python map()用法及代碼示例
- Python ord()用法及代碼示例
- Python hex()用法及代碼示例
- Python tell()用法及代碼示例
- Python int()用法及代碼示例
- Python oct()用法及代碼示例
- Python id()用法及代碼示例
- Python cmp()用法及代碼示例
- Python str()用法及代碼示例
- Python dir()用法及代碼示例
- Python sum()用法及代碼示例
- Python property()用法及代碼示例
- Python format()用法及代碼示例
- Python range()用法及代碼示例
注:本文由純淨天空篩選整理自SHUBHAMSINGH10大神的英文原創作品 Matplotlib.axis.Tick.set() function in Python。非經特殊聲明,原始代碼版權歸原作者所有,本譯文未經允許或授權,請勿轉載或複製。