Matplotlib是Python中的一個庫,它是數字的-NumPy庫的數學擴展。它是Python中令人驚歎的可視化庫,用於數組的2D圖,並用於與更廣泛的SciPy堆棧配合使用。
Matplotlib.axis.Tick.findobj()函數
matplotlib庫的軸模塊中的Tick.findobj()函數用於查找藝術家對象。
用法: Tick.findobj(self, match=None, include_self=True)
參數:此方法接受以下參數。
- match:此參數是匹配的過濾條件。默認值為無。
- include_self:此參數將self包含在要檢查是否匹配的列表中。
返回值:此方法返回藝術家(藝術家列表)。
以下示例說明了matplotlib.axis中的matplotlib.axis.Tick.findobj()函數:
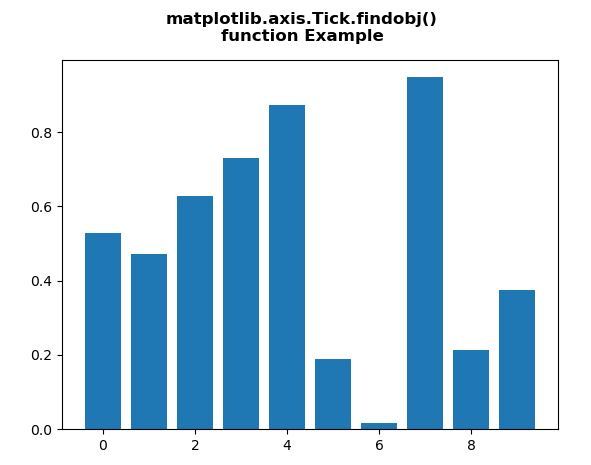
範例1:
Python3
# Implementation of matplotlib function
from matplotlib.axis import Tick
import matplotlib.pyplot as plt
from matplotlib.lines import Line2D
import numpy as np
from numpy.random import rand


fig, ax2 = plt.subplots()

ax2.bar(range(10), rand(10), picker = True)

print("Value return:\n",
      *list(Tick.findobj(ax2)), sep ="\n")

fig.suptitle("""matplotlib.axis.Tick.findobj()
function Example\n""", fontweight ="bold")

plt.show()
輸出:
Value return:

Rectangle(xy=(-0.4, 0), width=0.8, height=0.787316, angle=0)
Rectangle(xy=(0.6, 0), width=0.8, height=0.901399, angle=0)
Rectangle(xy=(1.6, 0), width=0.8, height=0.783699, angle=0)
Rectangle(xy=(2.6, 0), width=0.8, height=0.516764, angle=0)
Rectangle(xy=(3.6, 0), width=0.8, height=0.284635, angle=0)
Rectangle(xy=(4.6, 0), width=0.8, height=0.228809, angle=0)
Rectangle(xy=(5.6, 0), width=0.8, height=0.347976, angle=0)
Rectangle(xy=(6.6, 0), width=0.8, height=0.311647, angle=0)
Rectangle(xy=(7.6, 0), width=0.8, height=0.0261189, angle=0)
Rectangle(xy=(8.6, 0), width=0.8, height=0.921416, angle=0)
Spine
Spine
Spine
Spine
Text(0.5, 0, '')
Text(1, 0, '')
Line2D()
Line2D()
Line2D((0,0),(0,1))
Text(0, 0, '')
Text(0, 1, '')
<matplotlib.axis.XTick object at 0x08917330>
Line2D()
Line2D()
Line2D((0,0),(0,1))
Text(0, 0, '')
Text(0, 1, '')
<matplotlib.axis.XTick object at 0x08917310>
Line2D()
Line2D()
Line2D((0,0),(0,1))
Text(0, 0, '')
Text(0, 1, '')
<matplotlib.axis.XTick object at 0x0A92A890>
Line2D()
Line2D()
Line2D((0,0),(0,1))
Text(0, 0, '')
Text(0, 1, '')
<matplotlib.axis.XTick object at 0x0A940D90>
Line2D()
Line2D()
Line2D((0,0),(0,1))
Text(0, 0, '')
Text(0, 1, '')
<matplotlib.axis.XTick object at 0x0A9540B0>
Line2D()
Line2D()
Line2D((0,0),(0,1))
Text(0, 0, '')
Text(0, 1, '')
<matplotlib.axis.XTick object at 0x0A9542B0>
Line2D()
Line2D()
Line2D((0,0),(0,1))
Text(0, 0, '')
Text(0, 1, '')
<matplotlib.axis.XTick object at 0x0A954570>
XAxis(80.0,52.8)
Text(0, 0.5, '')
Text(0, 0.5, '')
Line2D()
Line2D()
Line2D((0,0),(1,0))
Text(0, 0, '')
Text(1, 0, '')
<matplotlib.axis.YTick object at 0x08917A30>
Line2D()
Line2D()
Line2D((0,0),(1,0))
Text(0, 0, '')
Text(1, 0, '')
<matplotlib.axis.YTick object at 0x089176B0>
Line2D()
Line2D()
Line2D((0,0),(1,0))
Text(0, 0, '')
Text(1, 0, '')
<matplotlib.axis.YTick object at 0x0A9547B0>
Line2D()
Line2D()
Line2D((0,0),(1,0))
Text(0, 0, '')
Text(1, 0, '')
<matplotlib.axis.YTick object at 0x0A954BF0>
Line2D()
Line2D()
Line2D((0,0),(1,0))
Text(0, 0, '')
Text(1, 0, '')
<matplotlib.axis.YTick object at 0x0A954ED0>
Line2D()
Line2D()
Line2D((0,0),(1,0))
Text(0, 0, '')
Text(1, 0, '')
<matplotlib.axis.YTick object at 0x0A95E190>
YAxis(80.0,52.8)
Text(0.5, 1.0, '')
Text(0.0, 1.0, '')
Text(1.0, 1.0, '')
Rectangle(xy=(0, 0), width=1, height=1, angle=0)
AxesSubplot(0.125,0.11;0.775x0.77)
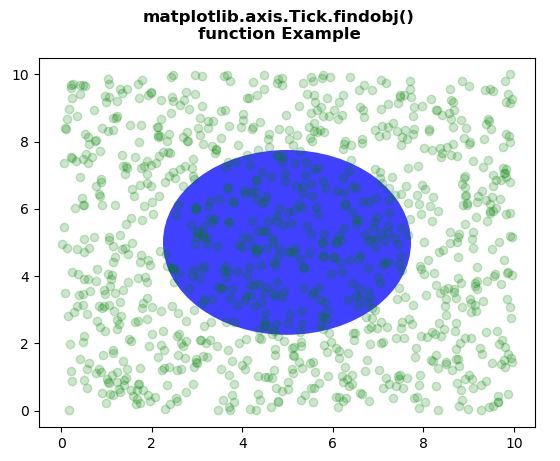
範例2:
Python3
# Implementation of matplotlib function
from matplotlib.axis import Tick
import numpy as np
import matplotlib.pyplot as plt
import matplotlib.patches as mpatches

fig, ax = plt.subplots()
x, y = 10 * np.random.rand(2, 1000)
ax.plot(x, y, 'go', alpha = 0.2)

circ = mpatches.Circle((0.5, 0.5), 0.25,
                       transform = ax.transAxes,
                       facecolor ='blue',
                       alpha = 0.75)
ax.add_patch(circ)

print("Value return:\n",
      *list(Tick.findobj(ax)), sep ="\n")

fig.suptitle("""matplotlib.axis.Tick.findobj()
function Example\n""", fontweight ="bold")

plt.show()
輸出:
Value return:

Circle(xy=(0.5, 0.5), radius=0.25)
Line2D(_line0)
Spine
Spine
Spine
Spine
Text(0.5, 0, '')
Text(1, 0, '')
Line2D()
Line2D()
Line2D((0,0),(0,1))
Text(0, 0, '')
Text(0, 1, '')
<matplotlib.axis.XTick object at 0x080C82F0>
Line2D()
Line2D()
Line2D((0,0),(0,1))
Text(0, 0, '')
Text(0, 1, '')
<matplotlib.axis.XTick object at 0x080C82D0>
Line2D()
Line2D()
Line2D((0,0),(0,1))
Text(0, 0, '')
Text(0, 1, '')
<matplotlib.axis.XTick object at 0x0A10BCF0>
Line2D()
Line2D()
Line2D((0,0),(0,1))
Text(0, 0, '')
Text(0, 1, '')
<matplotlib.axis.XTick object at 0x0A10BE10>
Line2D()
Line2D()
Line2D((0,0),(0,1))
Text(0, 0, '')
Text(0, 1, '')
<matplotlib.axis.XTick object at 0x0A1261F0>
Line2D()
Line2D()
Line2D((0,0),(0,1))
Text(0, 0, '')
Text(0, 1, '')
<matplotlib.axis.XTick object at 0x0A126490>
Line2D()
Line2D()
Line2D((0,0),(0,1))
Text(0, 0, '')
Text(0, 1, '')
<matplotlib.axis.XTick object at 0x0A126750>
Line2D()
Line2D()
Line2D((0,0),(0,1))
Text(0, 0, '')
Text(0, 1, '')
<matplotlib.axis.XTick object at 0x0A1269F0>
XAxis(80.0,52.8)
Text(0, 0.5, '')
Text(0, 0.5, '')
Line2D()
Line2D()
Line2D((0,0),(1,0))
Text(0, 0, '')
Text(1, 0, '')
<matplotlib.axis.YTick object at 0x080C8A10>
Line2D()
Line2D()
Line2D((0,0),(1,0))
Text(0, 0, '')
Text(1, 0, '')
<matplotlib.axis.YTick object at 0x080C8690>
Line2D()
Line2D()
Line2D((0,0),(1,0))
Text(0, 0, '')
Text(1, 0, '')
<matplotlib.axis.YTick object at 0x0A126B90>
Line2D()
Line2D()
Line2D((0,0),(1,0))
Text(0, 0, '')
Text(1, 0, '')
<matplotlib.axis.YTick object at 0x0A12F0D0>
Line2D()
Line2D()
Line2D((0,0),(1,0))
Text(0, 0, '')
Text(1, 0, '')
<matplotlib.axis.YTick object at 0x0A126E70>
Line2D()
Line2D()
Line2D((0,0),(1,0))
Text(0, 0, '')
Text(1, 0, '')
<matplotlib.axis.YTick object at 0x0A126970>
Line2D()
Line2D()
Line2D((0,0),(1,0))
Text(0, 0, '')
Text(1, 0, '')
<matplotlib.axis.YTick object at 0x0A10BDB0>
Line2D()
Line2D()
Line2D((0,0),(1,0))
Text(0, 0, '')
Text(1, 0, '')
<matplotlib.axis.YTick object at 0x0A12F4D0>
YAxis(80.0,52.8)
Text(0.5, 1.0, '')
Text(0.0, 1.0, '')
Text(1.0, 1.0, '')
Rectangle(xy=(0, 0), width=1, height=1, angle=0)
AxesSubplot(0.125,0.11;0.775x0.77)
相關用法
- Python Wand function()用法及代碼示例
- Python map()用法及代碼示例
- Python sum()用法及代碼示例
- Python id()用法及代碼示例
- Python int()用法及代碼示例
- Python oct()用法及代碼示例
- Python now()用法及代碼示例
- Python dir()用法及代碼示例
- Python hex()用法及代碼示例
- Python ord()用法及代碼示例
- Python cmp()用法及代碼示例
- Python str()用法及代碼示例
- Python tell()用法及代碼示例
- Python format()用法及代碼示例
- Python fmod()用法及代碼示例
- Python globals()用法及代碼示例
- Python frexp()用法及代碼示例
注:本文由純淨天空篩選整理自SHUBHAMSINGH10大神的英文原創作品 Matplotlib.axis.Tick.findobj() function in Python。非經特殊聲明,原始代碼版權歸原作者所有,本譯文未經允許或授權,請勿轉載或複製。