Matplotlib是Python中的一個庫,它是數字的-NumPy庫的數學擴展。它是Python中令人驚歎的可視化庫,用於數組的2D圖,並用於與更廣泛的SciPy堆棧配合使用。
Matplotlib.axis.Axis.zoom()函數
matplotlib庫的axis模塊中的Axis.zoom()函數用於在axis上放大或縮小。
用法: Axis.zoom(self, direction)
參數:此方法接受以下參數。
- direction:此參數是要放大(方向> 0)或縮小(方向<= 0)的值。
返回值:此方法不返回任何值。
以下示例說明了matplotlib.axis中的matplotlib.axis.Axis.zoom()函數:
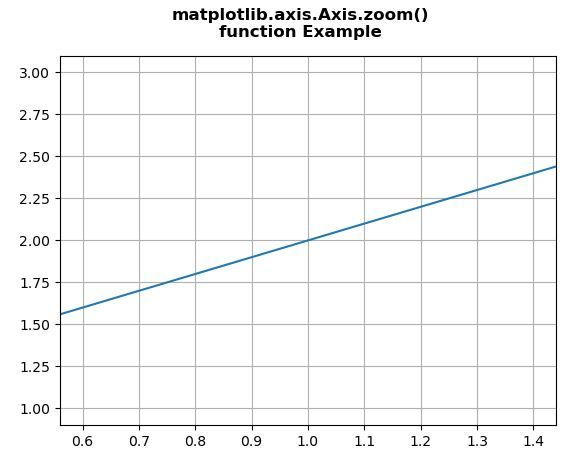
範例1:
Python3
# Implementation of matplotlib function
from matplotlib.axis import Axis
import matplotlib.pyplot as plt
import numpy as np

fig, ax = plt.subplots()
ax.plot([1, 2, 3])

ax.xaxis.zoom(3)

ax.grid()

fig.suptitle("""matplotlib.axis.Axis.zoom()
function Example\n""", fontweight ="bold")

plt.show()
輸出:
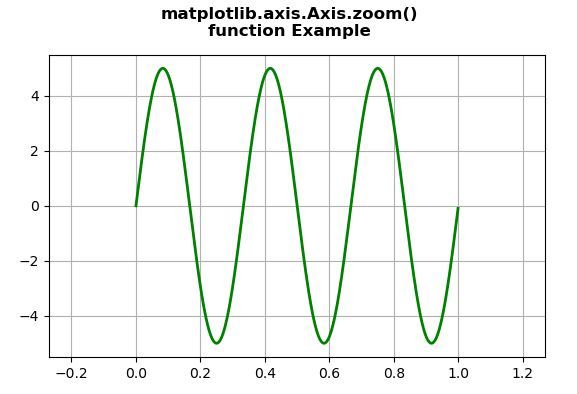
範例2:
Python3
# Implementation of matplotlib function
from matplotlib.axis import Axis
import numpy as np
import matplotlib.pyplot as plt
from matplotlib.widgets import Slider, Button, RadioButtons

fig, ax1 = plt.subplots()
plt.subplots_adjust(bottom = 0.25)
t = np.arange(0.0, 1.0, 0.001)

a0 = 5
f0 = 3
delta_f = 5.0
s = a0 * np.sin(2 * np.pi * f0 * t)

ax1.plot(t, s, lw = 2, color = 'green')

ax1.xaxis.zoom(-2)

ax1.grid()

fig.suptitle("""matplotlib.axis.Axis.zoom()
function Example\n""", fontweight ="bold")

plt.show()
輸出:
相關用法
- Python Wand function()用法及代碼示例
- Python hex()用法及代碼示例
- Python ord()用法及代碼示例
- Python now()用法及代碼示例
- Python map()用法及代碼示例
- Python sum()用法及代碼示例
- Python id()用法及代碼示例
- Python dir()用法及代碼示例
- Python tell()用法及代碼示例
- Python int()用法及代碼示例
- Python str()用法及代碼示例
- Python oct()用法及代碼示例
- Python cmp()用法及代碼示例
- Python globals()用法及代碼示例
- Python Wand fx()用法及代碼示例
- Python randint()用法及代碼示例
注:本文由純淨天空篩選整理自SHUBHAMSINGH10大神的英文原創作品 Matplotlib.axis.Axis.zoom() function in Python。非經特殊聲明,原始代碼版權歸原作者所有,本譯文未經允許或授權,請勿轉載或複製。