Matplotlib是Python中的一個庫,它是數字的-NumPy庫的數學擴展。它是Python中令人驚歎的可視化庫,用於數組的2D圖,並用於與更廣泛的SciPy堆棧配合使用。
Matplotlib.axis.Axis.set_rasterized()函數
matplotlib庫的軸模塊中的Axis.set_rasterized()函數用於強製在矢量後端輸出中進行柵格化(位圖)繪圖。
用法: Axis.set_rasterized(self, rasterized)
參數:此方法接受以下參數。
- rasterized:此參數是布爾值。
返回值:此方法不返回任何值。
以下示例說明了matplotlib.axis中的matplotlib.axis.Axis.set_rasterized()函數:
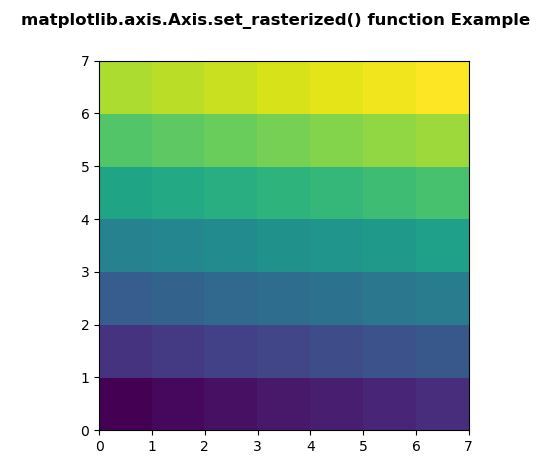
範例1:
Python3
# Implementation of matplotlib function
from matplotlib.axis import Axis
import numpy as np
import matplotlib.pyplot as plt


d = np.arange(49).reshape(7, 7)
xx, yy = np.meshgrid(np.arange(8), np.arange(8))

fig, ax = plt.subplots()

ax.set_aspect(1)
m = ax.pcolormesh(xx, yy, d)
Axis.set_rasterized(m, True)

fig.suptitle('matplotlib.axis.Axis.set_rasterized() \
function Example\n', fontweight ="bold")

plt.show()
輸出:
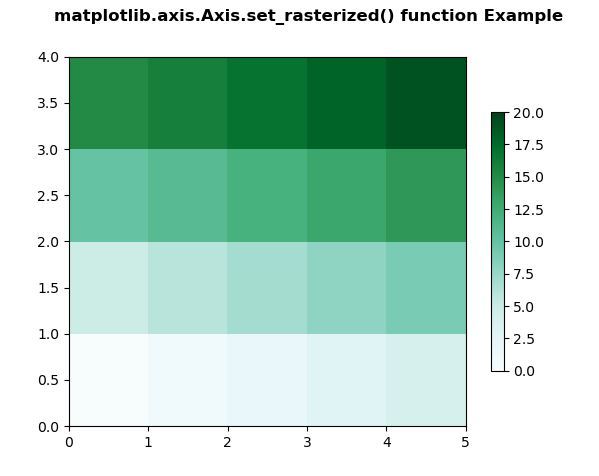
範例2:
Python3
# Implementation of matplotlib function
from matplotlib.axis import Axis
import matplotlib.pyplot as plt
import matplotlib.colors as mcolors
import matplotlib.gridspec as gridspec
import numpy as np


arr = np.arange(20).reshape((4, 5))
norm = mcolors.Normalize(vmin = 0., vmax = 20.)

pc_kwargs = {'cmap':'BuGn', 'norm':norm}

fig, ax = plt.subplots( )

im = ax.pcolormesh(arr, **pc_kwargs)
fig.colorbar(im, ax = ax, shrink = 0.7)
Axis.set_rasterized(im, False)

fig.suptitle('matplotlib.axis.Axis.set_rasterized() \
function Example\n', fontweight ="bold")

plt.show()
輸出:
相關用法
- Python Wand function()用法及代碼示例
- Python hex()用法及代碼示例
- Python tell()用法及代碼示例
- Python sum()用法及代碼示例
- Python oct()用法及代碼示例
- Python id()用法及代碼示例
- Python now()用法及代碼示例
- Python str()用法及代碼示例
- Python map()用法及代碼示例
- Python cmp()用法及代碼示例
- Python ord()用法及代碼示例
- Python dir()用法及代碼示例
- Python int()用法及代碼示例
- Python Wand fx()用法及代碼示例
- Python property()用法及代碼示例
- Python ldexp()用法及代碼示例
- Python fmod()用法及代碼示例
注:本文由純淨天空篩選整理自SHUBHAMSINGH10大神的英文原創作品 Matplotlib.axis.Axis.set_rasterized() function in Python。非經特殊聲明,原始代碼版權歸原作者所有,本譯文未經允許或授權,請勿轉載或複製。