Matplotlib是Python中的一個庫,它是數字的-NumPy庫的數學擴展。它是Python中令人驚歎的可視化庫,用於數組的2D圖,並用於與更廣泛的SciPy堆棧配合使用。
matplotlib.axis.Axis.set_minor_locator()函數
matplotlib庫的軸模塊中的Axis.set_minor_locator()函數用於設置次要股票代碼的定位器。
用法: Axis.set_minor_locator(self, locator)
參數:此方法接受以下參數。
- formatter:此參數是定位器。
返回值:此方法不返回任何值。
以下示例說明了matplotlib.axis中的matplotlib.axis.Axis.set_minor_locator()函數:
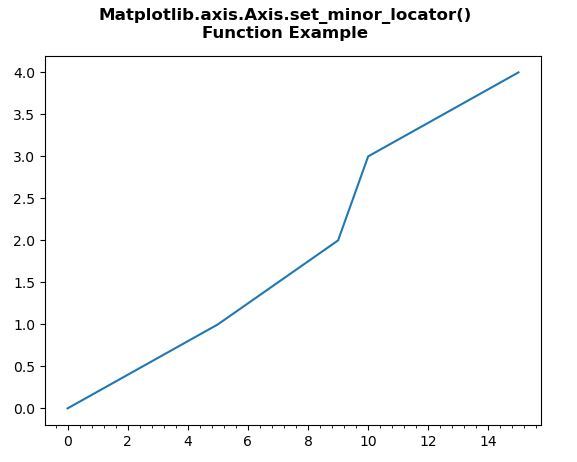
範例1:
Python3
# Implementation of matplotlib function
from matplotlib.axis import Axis
import matplotlib.pyplot as plt
import matplotlib.ticker as ticker


x = [0, 5, 9, 10, 15]
y = [0, 1, 2, 3, 4]

tick_spacing = 0.4

fig, ax = plt.subplots(1, 1)
ax.plot(x, y)
ax.xaxis.set_minor_locator(ticker.MultipleLocator(tick_spacing))

fig.suptitle("Matplotlib.axis.Axis.set_minor_locator()\n\
Function Example", fontsize = 12, fontweight ='bold')

plt.show()
輸出:
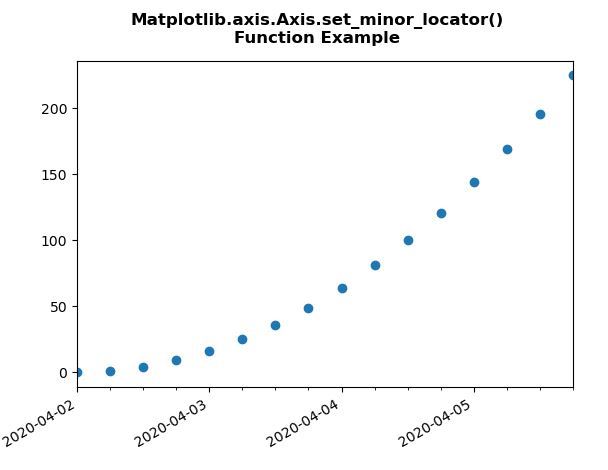
範例2:
Python3
# Implementation of matplotlib function
from matplotlib.axis import Axis
import datetime
import matplotlib.pyplot as plt
from matplotlib.dates import DayLocator, HourLocator, DateFormatter, drange
import numpy as np

date1 = datetime.datetime(2020, 4, 2)
date2 = datetime.datetime(2020, 4, 6)
delta = datetime.timedelta(hours = 6)
dates = drange(date1, date2, delta)

y = np.arange(len(dates))

fig, ax = plt.subplots()
ax.plot_date(dates, y ** 2)

ax.set_xlim(dates[0], dates[-1])

ax.xaxis.set_major_locator(DayLocator())
Axis.set_minor_locator(ax.xaxis, HourLocator(range(0, 25, 6)))
ax.xaxis.set_major_formatter(DateFormatter('%Y-%m-%d'))

ax.fmt_xdata = DateFormatter('%Y-%m-%d %H:%M:%S')
fig.autofmt_xdate()

fig.suptitle("Matplotlib.axis.Axis.set_minor_locator()\n\
Function Example", fontsize = 12, fontweight ='bold')

plt.show()
輸出:
相關用法
- Python Wand function()用法及代碼示例
- Python map()用法及代碼示例
- Python oct()用法及代碼示例
- Python str()用法及代碼示例
- Python tell()用法及代碼示例
- Python sum()用法及代碼示例
- Python ord()用法及代碼示例
- Python dir()用法及代碼示例
- Python int()用法及代碼示例
- Python id()用法及代碼示例
- Python now()用法及代碼示例
- Python hex()用法及代碼示例
- Python cmp()用法及代碼示例
- Python statistics mean()用法及代碼示例
- Python bytearray()用法及代碼示例
- Python locals()用法及代碼示例
注:本文由純淨天空篩選整理自SHUBHAMSINGH10大神的英文原創作品 Matplotlib.axis.Axis.set_minor_locator() function in Python。非經特殊聲明,原始代碼版權歸原作者所有,本譯文未經允許或授權,請勿轉載或複製。