Matplotlib是Python中的一個庫,它是數字的-NumPy庫的數學擴展。它是Python中令人驚歎的可視化庫,用於數組的2D圖,並用於與更廣泛的SciPy堆棧配合使用。
Matplotlib.axis.Axis.set_label_text()函數
matplotlib庫的軸模塊中的Axis.set_label_text()函數用於設置軸標簽的文本值。
用法: Axis.set_label_text(self, label, fontdict=None, **kwargs)
參數:此方法接受以下參數。
- label:此參數是文本字符串。
- fontdict:此參數是文本屬性。
返回值:此方法不返回任何值。
以下示例說明了matplotlib.axis中的matplotlib.axis.Axis.set_label_text()函數:
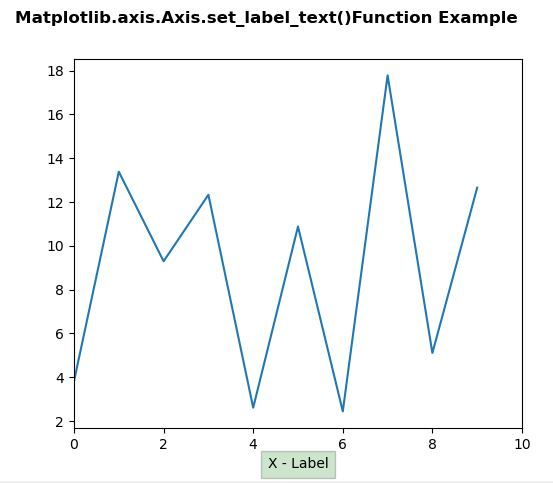
範例1:
Python3
# Implementation of matplotlib function
from matplotlib.axis import Axis
import numpy as np
import matplotlib.pyplot as plt

fig, ax2 = plt.subplots(sharex = True)
fig.subplots_adjust(left=0.2, wspace=0.6)
box = dict(facecolor='green', pad=5, alpha=0.2)

ax2.plot(20*np.random.rand(10))
ax2.xaxis.set_label_text('X - Label', bbox=box)
ax2.set_xlim(0, 10)

fig.suptitle("Matplotlib.axis.Axis.set_label_text()\
Function Example", fontsize = 12, fontweight ='bold')

plt.show()
輸出:
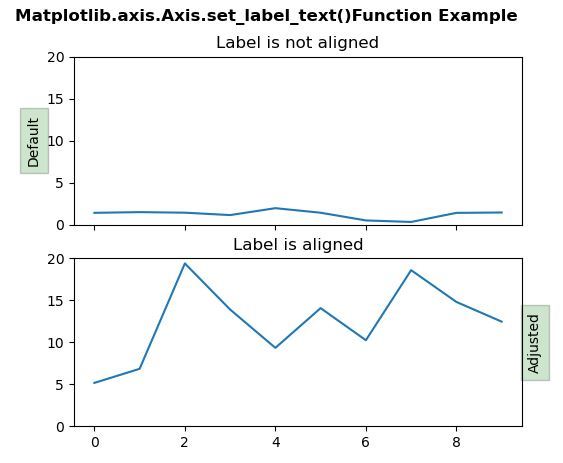
範例2:
Python3
# Implementation of matplotlib function
from matplotlib.axis import Axis
import numpy as np
import matplotlib.pyplot as plt

fig, (ax1, ax2) = plt.subplots(2, 1, sharex = True)
fig.subplots_adjust(left=0.2, wspace=0.6)
box = dict(facecolor='green', pad=5, alpha=0.2)

np.random.seed(19680801)
ax1.plot(2*np.random.rand(10))
ax1.set_title('Label is not aligned')
ax1.yaxis.set_label_text('Default', bbox=box)
ax1.set_ylim(0, 20)

ax2.set_title('\nLabel is aligned')
ax2.plot(20*np.random.rand(10))
ax2.yaxis.set_label_text('Adjusted', bbox=box)
ax2.yaxis.set_label_position('right')
ax2.set_ylim(0, 20)

fig.suptitle("Matplotlib.axis.Axis.set_label_text()\
Function Example", fontsize = 12, fontweight ='bold')

plt.show()
輸出:
相關用法
- Python Wand function()用法及代碼示例
- Python hex()用法及代碼示例
- Python tell()用法及代碼示例
- Python sum()用法及代碼示例
- Python oct()用法及代碼示例
- Python id()用法及代碼示例
- Python now()用法及代碼示例
- Python str()用法及代碼示例
- Python map()用法及代碼示例
- Python cmp()用法及代碼示例
- Python ord()用法及代碼示例
- Python dir()用法及代碼示例
- Python int()用法及代碼示例
- Python Wand fx()用法及代碼示例
- Python property()用法及代碼示例
- Python ldexp()用法及代碼示例
- Python fmod()用法及代碼示例
注:本文由純淨天空篩選整理自SHUBHAMSINGH10大神的英文原創作品 Matplotlib.axis.Axis.set_label_text() function in Python。非經特殊聲明,原始代碼版權歸原作者所有,本譯文未經允許或授權,請勿轉載或複製。