Matplotlib是Python中的一個庫,它是數字的-NumPy庫的數學擴展。它是Python中令人驚歎的可視化庫,用於數組的2D圖,並用於與更廣泛的SciPy堆棧配合使用。
Matplotlib.axis.Axis.limit_range_for_scale()函數
matplotlib庫的軸模塊中的Axis.limit_range_for_scale()函數用於re-initialize主和次要Tick列表。
用法: Axis.limit_range_for_scale(self, vmin, vmax)
參數:此方法接受以下參數。
- vmin:此參數是最小值。
- vmax:此參數是最大值。
返回值:此方法不返回任何值。
以下示例說明了matplotlib.axis中的matplotlib.axis.Axis.limit_range_for_scale()函數:
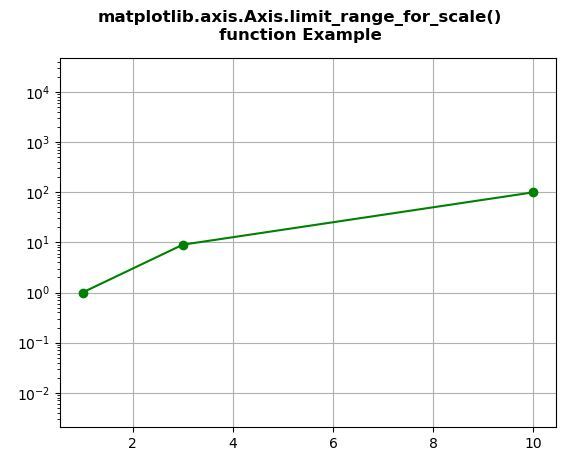
範例1:
Python3
# Implementation of matplotlib function
from matplotlib.axis import Axis
import matplotlib.pyplot as plt

fig, ax = plt.subplots()

ax.set_yscale("log")
ax.set_adjustable("datalim")
ax.plot([1, 3, 10], [1, 9, 100], "o-",color="green")
ax.set_aspect(1)

ax.xaxis.limit_range_for_scale(0,5)

ax.grid()

fig.suptitle("""matplotlib.axis.Axis.limit_range_for_scale()
function Example\n""", fontweight ="bold")

plt.show()
輸出:
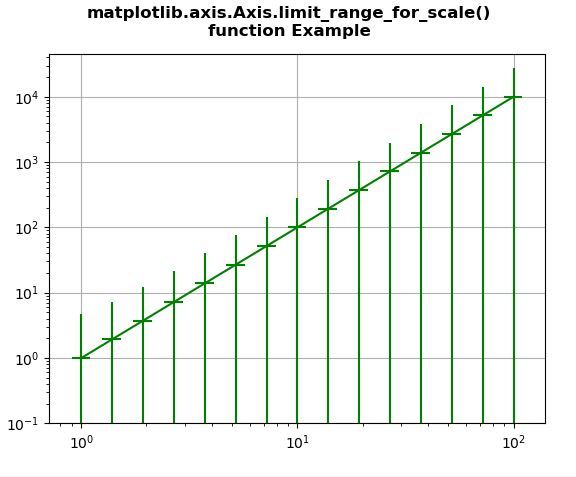
範例2:
Python3
# Implementation of matplotlib function
from matplotlib.axis import Axis
import numpy as np
import matplotlib.pyplot as plt


fig, ax4 = plt.subplots()

x = 10.0**np.linspace(0.0, 2.0, 15)
y = x**2.0
ax4.set_xscale("log", nonposx='clip')
ax4.set_yscale("log", nonposy='clip')

ax4.errorbar(x, y, xerr=0.1 * x,
             yerr=2.0 + 1.75 * y,
             color="green")

ax4.set_ylim(bottom=0.1)

ax4.xaxis.limit_range_for_scale(0,5)
ax4.yaxis.limit_range_for_scale(3,5)

ax4.grid()

fig.suptitle("""matplotlib.axis.Axis.limit_range_for_scale()
function Example\n""", fontweight ="bold")

plt.show()
輸出:
相關用法
- Python Wand function()用法及代碼示例
- Python sum()用法及代碼示例
- Python dir()用法及代碼示例
- Python now()用法及代碼示例
- Python id()用法及代碼示例
- Python tell()用法及代碼示例
- Python cmp()用法及代碼示例
- Python str()用法及代碼示例
- Python hex()用法及代碼示例
- Python ord()用法及代碼示例
- Python oct()用法及代碼示例
- Python int()用法及代碼示例
- Python map()用法及代碼示例
- Python randint()用法及代碼示例
- Python globals()用法及代碼示例
- Python format()用法及代碼示例
- Python fmod()用法及代碼示例
注:本文由純淨天空篩選整理自SHUBHAMSINGH10大神的英文原創作品 Matplotlib.axis.Axis.limit_range_for_scale() function in Python。非經特殊聲明,原始代碼版權歸原作者所有,本譯文未經允許或授權,請勿轉載或複製。