Matplotlib是Python中的一個庫,它是數字的-NumPy庫的數學擴展。它是Python中令人驚歎的可視化庫,用於數組的2D圖,並用於與更廣泛的SciPy堆棧配合使用。
Matplotlib.axis.Axis.have_units()函數
matplotlib庫的軸模塊中的Axis.have_units()函數用於檢查是否在任何軸上設置了單位。
用法: Axis.have_units(self)
參數:此方法不接受任何參數。
返回值:如果在任何軸上設置單位,則此方法返回True。
以下示例說明了matplotlib.axis中的matplotlib.axis.Axis.have_units()函數:
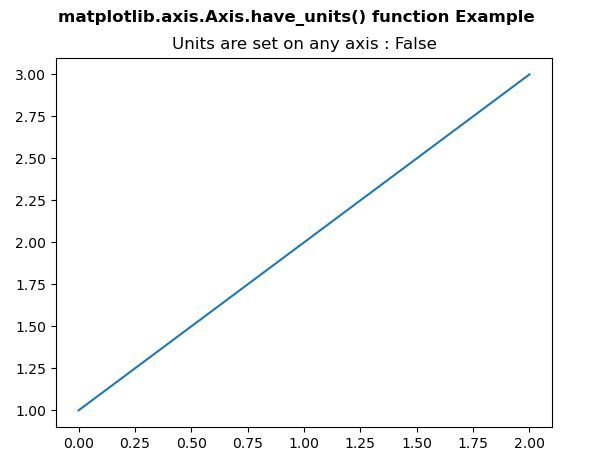
範例1:
Python3
# Implementation of matplotlib function
from matplotlib.axis import Axis
import matplotlib.pyplot as plt

fig, axs = plt.subplots()
axs.plot([1, 2, 3])

axs.set_title("Units are set on any axis:"
              +str(axs.xaxis.have_units()))

fig.suptitle('matplotlib.axis.Axis.have_units() \
function Example\n', fontweight ="bold")

plt.show()
輸出:
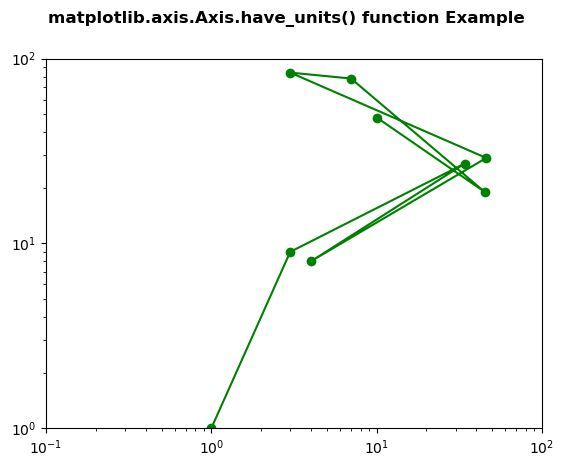
範例2:
Python3
# Implementation of matplotlib function
from matplotlib.axis import Axis
import matplotlib.pyplot as plt

fig, ax1 = plt.subplots( )
ax1.set_xscale("log")
ax1.set_yscale("log")
ax1.set_adjustable("datalim")

ax1.plot([1, 3, 34, 4, 46, 3, 7, 45, 10],
         [1, 9, 27, 8, 29, 84, 78, 19, 48],
          "o-", color ="green")

ax1.set_xlim(1e-1, 1e2)
ax1.set_ylim(1, 1e2)

w = Axis.have_units(ax1.yaxis)

print("Value Return by have_units():", w)

fig.suptitle('matplotlib.axis.Axis.have_units() \
function Example\n', fontweight ="bold")

plt.show()
輸出:
相關用法
- Python Wand function()用法及代碼示例
- Python hex()用法及代碼示例
- Python now()用法及代碼示例
- Python oct()用法及代碼示例
- Python int()用法及代碼示例
- Python id()用法及代碼示例
- Python tell()用法及代碼示例
- Python sum()用法及代碼示例
- Python ord()用法及代碼示例
- Python str()用法及代碼示例
- Python cmp()用法及代碼示例
- Python dir()用法及代碼示例
- Python map()用法及代碼示例
- Python fmod()用法及代碼示例
- Python globals()用法及代碼示例
- Python ldexp()用法及代碼示例
注:本文由純淨天空篩選整理自SHUBHAMSINGH10大神的英文原創作品 Matplotlib.axis.Axis.have_units() function in Python。非經特殊聲明,原始代碼版權歸原作者所有,本譯文未經允許或授權,請勿轉載或複製。