Matplotlib是Python中的一個庫,它是數字的-NumPy庫的數學擴展。它是Python中令人驚歎的可視化庫,用於數組的2D圖,並用於與更廣泛的SciPy堆棧配合使用。
matplotlib.axis.Axis.get_transformed_clip_path_and_affine()函數
matplotlib庫的axis模塊中的Axis.get_transformed_clip_path_and_affine()函數用於獲取應用了其變換的非仿射部分以及其變換的其餘仿射部分的剪輯路徑。
用法: Axis.get_transformed_clip_path_and_affine(self)
參數:此方法不接受任何參數。
返回值:此方法返回應用了其變換的非仿射部分和其變換的其餘仿射部分的剪輯路徑。
以下示例說明了matplotlib.axis中的matplotlib.axis.Axis.get_transformed_clip_path_and_affine()函數:
範例1:
使用的圖片:

Python3
# Implementation of matplotlib function
from matplotlib.axis import Axis
import matplotlib.pyplot as plt
import matplotlib.patches as patches
import matplotlib.cbook as cbook


with cbook.get_sample_data('image.PNG') as image_file:
    image = plt.imread(image_file)

fig, ax = plt.subplots()
im = ax.imshow(image)
patch = patches.Rectangle((50, 50), 200, 200,
                          transform = ax.transData)

# use of get_transformed_clip_path_and_affine() method
val = Axis.get_transformed_clip_path_and_affine(im)
ax.set_title("Value Return by get_transformed_clip_path_and_affine():"
             + str(val))

fig.suptitle("""matplotlib.axis.Axis.get_transformed_clip_path_and_affine()
function Example\n""", fontweight ="bold")

plt.show()
輸出:

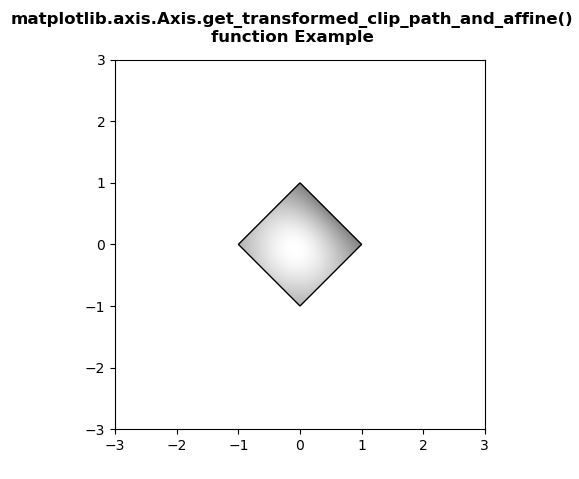
範例2:
Python3
# Implementation of matplotlib function
from matplotlib.axis import Axis
import numpy as np
import matplotlib.cm as cm
import matplotlib.pyplot as plt
from matplotlib.path import Path
from matplotlib.patches import PathPatch


delta = 0.025

x = y = np.arange(-3.0, 3.0, delta)
X, Y = np.meshgrid(x, y)

Z1 = np.exp(-X**2 - Y**2)
Z2 = np.exp(-(X - 1)**2 - (Y - 1)**2)
Z = (Z1 - Z2) * 2

path = Path([[0, 1], [1, 0], [0, -1], [-1, 0], [0, 1]])
patch = PathPatch(path, facecolor ='none')

fig, ax = plt.subplots()
ax.add_patch(patch)
im = ax.imshow(Z,
               interpolation ='bilinear',
               cmap = cm.gray,
               origin ='lower',
               extent =[-3, 3, -3, 3],
               clip_path = patch,
               clip_on = True)

# use of get_transformed_clip_path_and_affine() method
val = Axis.get_transformed_clip_path_and_affine(im)
print("Value Return by get_transformed_clip_path_and_affine():")
for i in val:
    print(i)

fig.suptitle("""matplotlib.axis.Axis.get_transformed_clip_path_and_affine()
function Example\n""", fontweight ="bold")

plt.show()
輸出:
Value Return by get_transformed_clip_path_and_affine():
Path(array([[ 0.,  1.],
       [ 1.,  0.],
       [ 0., -1.],
       [-1.,  0.],
       [ 0.,  1.]]), None)
Affine2D(
    [[ 82.66666667   0.         328.        ]
     [  0.          61.6        237.6       ]
     [  0.           0.           1.        ]])
相關用法
- Python Wand function()用法及代碼示例
- Python now()用法及代碼示例
- Python dir()用法及代碼示例
- Python hex()用法及代碼示例
- Python cmp()用法及代碼示例
- Python int()用法及代碼示例
- Python id()用法及代碼示例
- Python ord()用法及代碼示例
- Python str()用法及代碼示例
- Python tell()用法及代碼示例
- Python map()用法及代碼示例
- Python oct()用法及代碼示例
- Python sum()用法及代碼示例
- Python strftime()用法及代碼示例
- Python compile()用法及代碼示例
- Python cmath.sin()用法及代碼示例
注:本文由純淨天空篩選整理自SHUBHAMSINGH10大神的英文原創作品 Matplotlib.axis.Axis.get_transformed_clip_path_and_affine() function in Python。非經特殊聲明,原始代碼版權歸原作者所有,本譯文未經允許或授權,請勿轉載或複製。