Matplotlib是Python中的一個庫,它是數字的-NumPy庫的數學擴展。它是Python中令人驚歎的可視化庫,用於數組的2D圖,並用於與更廣泛的SciPy堆棧配合使用。
matplotlib.axis.Axis.get_ticklines()函數
matplotlib庫的軸模塊中的Axis.get_ticklines()函數用於獲取刻度線作為Line2D實例的列表。
用法: Axis.get_ticklines(self, minor=False)
參數:此方法接受以下參數。
- minor:此參數包含布爾值。如果為True,則返回次要刻度線,否則返回主次要刻度線。
返回值:此方法將刻度線作為Line2D實例的列表返回。
以下示例說明了matplotlib.axis中的matplotlib.axis.Axis.get_ticklines()函數:
範例1:
Python3
# Implementation of matplotlib function
from matplotlib.axis import Axis
import numpy as np
import matplotlib.pyplot as plt
from matplotlib.patches import Polygon


def func(x):
    return (x - 4) * (x - 6) * (x - 5) + 100


a, b = 2, 9  # integral limits
x = np.linspace(0, 10)
y = func(x)

fig, ax = plt.subplots()
ax.plot(x, y, "k", linewidth = 2)
ax.set_ylim(bottom = 0)

# Make the shaded region
ix = np.linspace(a, b)
iy = func(ix)
verts = [(a, 0), *zip(ix, iy), (b, 0)]

poly = Polygon(verts, facecolor ='green',
               edgecolor ='0.5', alpha = 0.4)
ax.add_patch(poly)

ax.text(0.5 * (a + b), 30,
        r"$\int_a ^ b f(x)\mathrm{d}x$",
        horizontalalignment ='center',
        fontsize = 20)

fig.text(0.9, 0.05, '$x$')
fig.text(0.1, 0.9, '$y$')

ax.spines['right'].set_visible(False)
ax.spines['top'].set_visible(False)

ax.set_xticks((a, b-a, b))
ax.set_xticklabels(('$a$', '$valx$', '$b$'))

fig.suptitle('Matplotlib.axis.Axis.get_ticklines()\n\
Function Example', fontweight ="bold")
ax.grid()

print("Value of get_ticklines():")
for i in ax.xaxis.get_ticklines():
    print(i)

plt.show()
輸出:
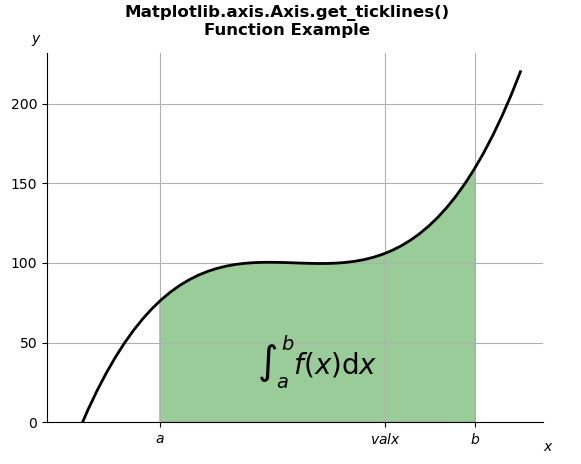
Value of get_ticklines():
Line2D()
Line2D()
Line2D()
Line2D()
Line2D()
Line2D()
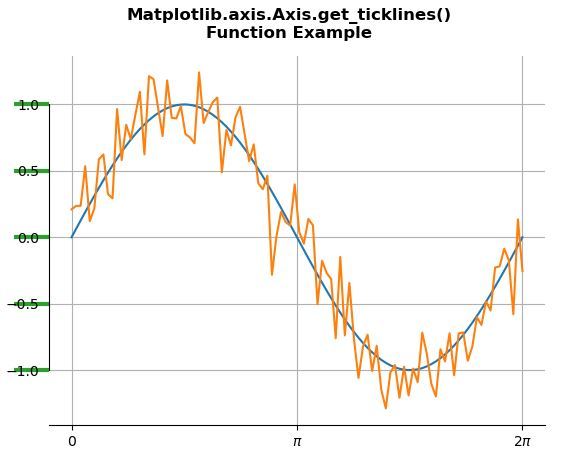
範例2:
Python3
# Implementation of matplotlib function
from matplotlib.axis import Axis
import numpy as np
import matplotlib.pyplot as plt

# Fixing random state for reproducibility
np.random.seed(19680801)

x = np.linspace(0, 2 * np.pi, 100)
y = np.sin(x)
y2 = y + 0.2 * np.random.normal(size = x.shape)

fig, ax = plt.subplots()
ax.plot(x, y)
ax.plot(x, y2)

ax.set_xticks([0, np.pi, 2 * np.pi])
ax.set_xticklabels(['0', r'$\pi$', r'2$\pi$'])

for line in ax.yaxis.get_ticklines():
    # line is a Line2D instance
    line.set_color('tab:green')
    line.set_markersize(25)
    line.set_markeredgewidth(3)

ax.spines['left'].set_bounds(-1, 1)
ax.spines['right'].set_visible(False)
ax.spines['top'].set_visible(False)

fig.suptitle('Matplotlib.axis.Axis.get_ticklines()\n\
Function Example', fontweight ="bold")
ax.grid()

plt.show()
輸出:
相關用法
- Python Wand function()用法及代碼示例
- Python map()用法及代碼示例
- Python cmp()用法及代碼示例
- Python oct()用法及代碼示例
- Python ord()用法及代碼示例
- Python str()用法及代碼示例
- Python dir()用法及代碼示例
- Python sum()用法及代碼示例
- Python hex()用法及代碼示例
- Python now()用法及代碼示例
- Python tell()用法及代碼示例
- Python int()用法及代碼示例
- Python id()用法及代碼示例
- Python cmath.sin()用法及代碼示例
注:本文由純淨天空篩選整理自SHUBHAMSINGH10大神的英文原創作品 Matplotlib.axis.Axis.get_ticklines() function in Python。非經特殊聲明,原始代碼版權歸原作者所有,本譯文未經允許或授權,請勿轉載或複製。