Matplotlib是Python中的一個庫,它是數字的-NumPy庫的數學擴展。它是Python中令人驚歎的可視化庫,用於數組的2D圖,並用於與更廣泛的SciPy堆棧配合使用。
Matplotlib.axis.Axis.get_picker()函數
matplotlib庫的axis模塊中的Axis.get_picker()函數用於定義藝術家的挑選行為。
用法: Axis.get_picker(self)
參數:此方法不接受任何參數。
返回值:此方法返回藝術家的挑選行為。
以下示例說明了matplotlib.axis中的matplotlib.axis.Axis.get_picker()函數:
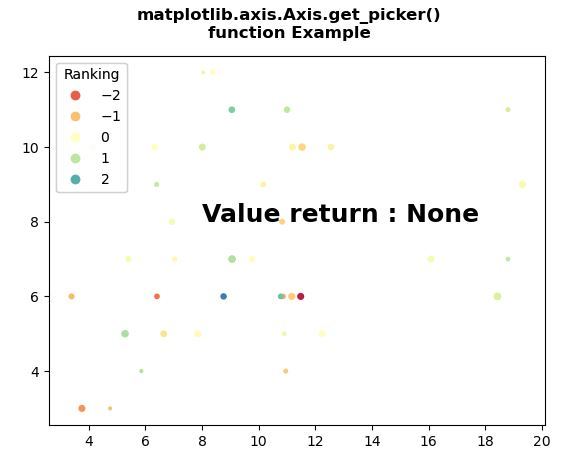
範例1:
Python3
# Implementation of matplotlib function
from matplotlib.axis import Axis
import numpy as np
import matplotlib.pyplot as plt


np.random.seed(19680801)

volume = np.random.rayleigh(7, size = 40)
amount = np.random.poisson(7, size = 40)
ranking = np.random.normal(size = 40)
price = np.random.uniform(1, 7, size = 40)

fig, ax = plt.subplots()

scatter = ax.scatter(volume,
                     amount,
                     c = ranking,
                     s = price * 3,
                     vmin = -3,
                     vmax = 3,
                     cmap = "Spectral")

legend1 = ax.legend(*scatter.legend_elements(num = 5),
                    loc = "upper left",
                    title = "Ranking")

ax.add_artist(legend1)

ax.text(8, 8, "Value return:"
        + str(Axis.get_picker(ax)),
        fontweight = "bold",
        fontsize = 18)

fig.suptitle("""matplotlib.axis.Axis.get_picker()
function Example\n""", fontweight ="bold")

plt.show()
輸出:
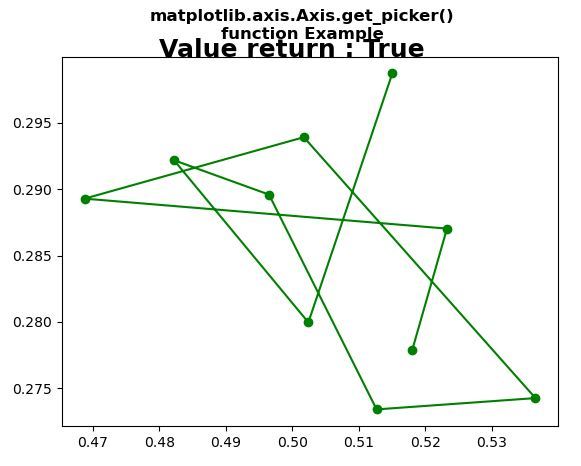
範例2:
Python3
# Implementation of matplotlib function
from matplotlib.axis import Axis
import numpy as np
import matplotlib.pyplot as plt


X = np.random.rand(10, 200)
xs = np.mean(X, axis = 1)
ys = np.std(X, axis = 1)

fig = plt.figure()
ax = fig.add_subplot(111)
line, = ax.plot(xs, ys, 'go-', picker = 5)

ax.set_picker(True)

ax.text(0.48, 0.3, "Value return:"
        +  str(Axis.get_picker(ax)),
        fontweight = "bold",
        fontsize = 18)

fig.suptitle("""matplotlib.axis.Axis.get_picker()
function Example\n""", fontweight ="bold")

plt.show()
輸出:
相關用法
- Python Wand function()用法及代碼示例
- Python hex()用法及代碼示例
- Python now()用法及代碼示例
- Python oct()用法及代碼示例
- Python int()用法及代碼示例
- Python id()用法及代碼示例
- Python tell()用法及代碼示例
- Python sum()用法及代碼示例
- Python ord()用法及代碼示例
- Python str()用法及代碼示例
- Python cmp()用法及代碼示例
- Python dir()用法及代碼示例
- Python map()用法及代碼示例
- Python fmod()用法及代碼示例
- Python globals()用法及代碼示例
- Python ldexp()用法及代碼示例
注:本文由純淨天空篩選整理自SHUBHAMSINGH10大神的英文原創作品 Matplotlib.axis.Axis.get_picker() function in Python。非經特殊聲明,原始代碼版權歸原作者所有,本譯文未經允許或授權,請勿轉載或複製。