Matplotlib是Python中的一個庫,它是數字的-NumPy庫的數學擴展。它是Python中令人驚歎的可視化庫,用於數組的2D圖,並用於與更廣泛的SciPy堆棧配合使用。
matplotlib.axis.Axis.get_majorticklines()函數
matplotlib庫的axis模塊中的Axis.get_majorticklines()函數用於獲取主要的刻度線作為Line2D實例的列表。
用法: Axis.get_majorticklines(self)
參數:此方法不接受任何參數。
返回值:此方法返回主要刻度線作為Line2D實例的列表
以下示例說明了matplotlib.axis中的matplotlib.axis.Axis.get_majorticklines()函數:
範例1:
Python3
# Implementation of matplotlib function
from matplotlib.axis import Axis
from matplotlib.artist import Artist
from mpl_toolkits.mplot3d import axes3d
import matplotlib.pyplot as plt

fig, ax = plt.subplots()

def tellme(s):
    ax.set_title(s, fontsize = 16)
    fig.canvas.draw()
    renderer = fig.canvas.renderer
    Artist.draw(ax, renderer)

tellme("Matplotlib.axis.Axis.get_majorticklines()\n\
Function Example")
ax.grid()

print("Value of get_majorticklines():")
for i in ax.xaxis.get_majorticklines():
    print(i)

plt.show()
輸出:
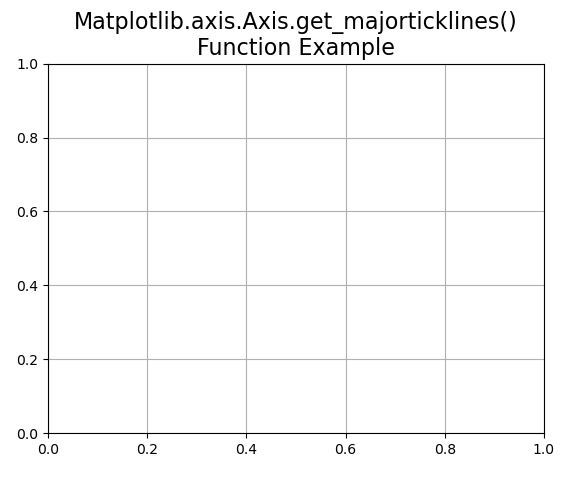
Value of get_majorticklines():
Line2D((0,0))
Line2D()
Line2D((0.2,0))
Line2D()
Line2D((0.4,0))
Line2D()
Line2D((0.6,0))
Line2D()
Line2D((0.8,0))
Line2D()
Line2D((1,0))
Line2D()
範例2:
Python3
# Implementation of matplotlib function
from matplotlib.axis import Axis
from matplotlib.artist import Artist
from mpl_toolkits.mplot3d import axes3d
import matplotlib.pyplot as plt


fig = plt.figure()
ax = fig.add_subplot(111, projection ='3d')

X, Y, Z = axes3d.get_test_data(0.1)
ax.plot_wireframe(X, Y, Z, rstride = 5,
                  cstride = 5)


ax.view_init(30, 50)
fig.canvas.draw()
renderer = fig.canvas.renderer
Artist.draw(ax, renderer)

fig.suptitle('Matplotlib.axis.Axis.get_majorticklines()\n\
Function Example')
ax.grid()

print("Value of get_majorticklines():")
for i in ax.xaxis.get_majorticklines():
    print(i)

plt.show()
輸出:
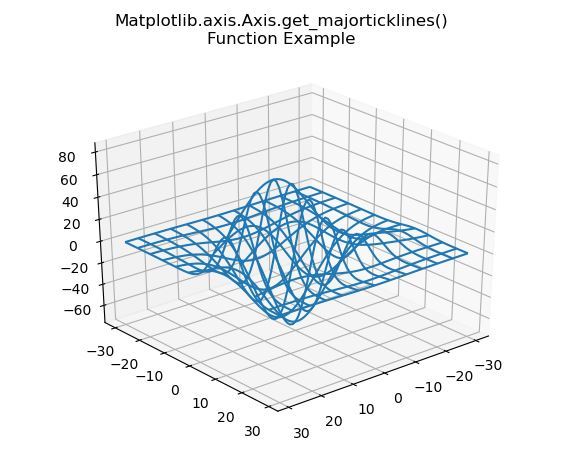
Value of get_majorticklines():
Line2D()
Line2D()
Line2D((0.0666078,-0.049272),(0.0682987,-0.0502952))
Line2D()
Line2D((0.0554732,-0.0546),(0.0571602,-0.0556407))
Line2D()
Line2D((0.0441478,-0.0600194),(0.0458304,-0.0610781))
Line2D()
Line2D((0.0326263,-0.0655326),(0.0343043,-0.0666097))
Line2D()
Line2D((0.0209039,-0.071142),(0.0225766,-0.072238))
Line2D()
Line2D((0.00897501,-0.0768502),(0.0106422,-0.0779655))
Line2D()
Line2D((-0.00316569,-0.0826597),(-0.00150454,-0.083795))
Line2D()
Line2D()
Line2D()
相關用法
- Python Wand function()用法及代碼示例
- Python hex()用法及代碼示例
- Python now()用法及代碼示例
- Python oct()用法及代碼示例
- Python int()用法及代碼示例
- Python id()用法及代碼示例
- Python tell()用法及代碼示例
- Python sum()用法及代碼示例
- Python ord()用法及代碼示例
- Python str()用法及代碼示例
- Python cmp()用法及代碼示例
- Python dir()用法及代碼示例
- Python map()用法及代碼示例
- Python fmod()用法及代碼示例
- Python globals()用法及代碼示例
- Python ldexp()用法及代碼示例
注:本文由純淨天空篩選整理自SHUBHAMSINGH10大神的英文原創作品 Matplotlib.axis.Axis.get_majorticklines() function in Python。非經特殊聲明,原始代碼版權歸原作者所有,本譯文未經允許或授權,請勿轉載或複製。