Matplotlib是Python中的一個庫,它是數字的-NumPy庫的數學擴展。它是Python中令人驚歎的可視化庫,用於數組的2D圖,並用於與更廣泛的SciPy堆棧配合使用。
Matplotlib.axis.Axis.get_majorticklabels()函數
matplotlib庫的axis模塊中的Axis.get_majorticklabels()函數用於獲取主要ticklabel的Text實例列表。
用法: Axis.get_majorticklabels(self)
參數:此方法不接受任何參數。
返回值:此方法返回主要ticklabel的Text實例列表。
以下示例說明了matplotlib.axis中的matplotlib.axis.Axis.get_majorticklabels()函數:
範例1:
Python3
# Implementation of matplotlib function
import numpy as np
from matplotlib.axis import Axis
import matplotlib.pyplot as plt
import matplotlib.ticker as ticker

np.random.seed(19680801)

fig, ax = plt.subplots()
ax.plot(100*np.random.rand(20))

formatter = ticker.FormatStrFormatter('%1.2f')
Axis.set_major_formatter(ax.yaxis, formatter)

print("Value of get_major_ticks():")
for i in ax.xaxis.get_majorticklabels():
    print(i)

plt.title("Matplotlib.axis.Axis.get_majorticklabels()\n\
Function Example", fontsize = 12, fontweight ='bold')
plt.show()
輸出:
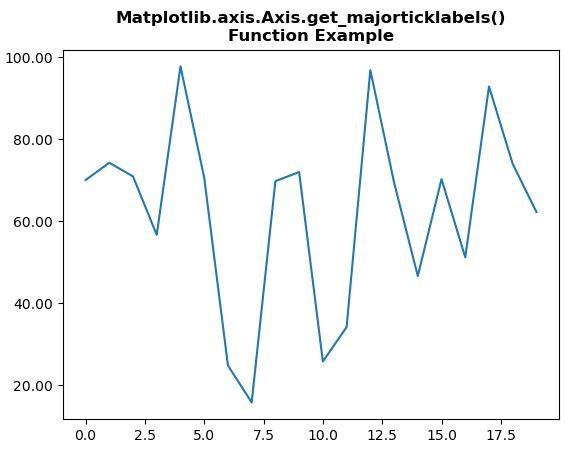
Value of get_majorticklabels():
Text(0, 0, '')
Text(0, 0, '')
Text(0, 0, '')
Text(0, 0, '')
Text(0, 0, '')
Text(0, 0, '')
Text(0, 0, '')
Text(0, 0, '')
Text(0, 0, '')
Text(0, 0, '')
範例2:
Python3
# Implementation of matplotlib function
from matplotlib.axis import Axis
from matplotlib.artist import Artist
import matplotlib.pyplot as plt
import numpy as np

np.random.seed(19680801)

n = 100000
x = np.random.standard_normal(n)
y = 2 * np.random.standard_normal(n)
z =[1, 2, 3, 4]

xmin = x.min()
xmax = x.max()
ymin = y.min()
ymax = y.max()

fig, ax = plt.subplots()
hb = ax.hexbin(x, y,
               gridsize = 50,
               bins ='log',
               cmap ='BuGn')

ax.set(xlim =(xmin, xmax), ylim =(ymin, ymax))
ax.xaxis.set_ticklabels(["A","B","C","D","E","F","G","H","I","J","K"])
print("Value of get_majorticklabels():")
for i in ax.xaxis.get_majorticklabels():
    print(i)

plt.title("Matplotlib.axis.Axis.get_majorticklabels()\n\
Function Example", fontsize = 12, fontweight ='bold')
plt.show()
輸出:
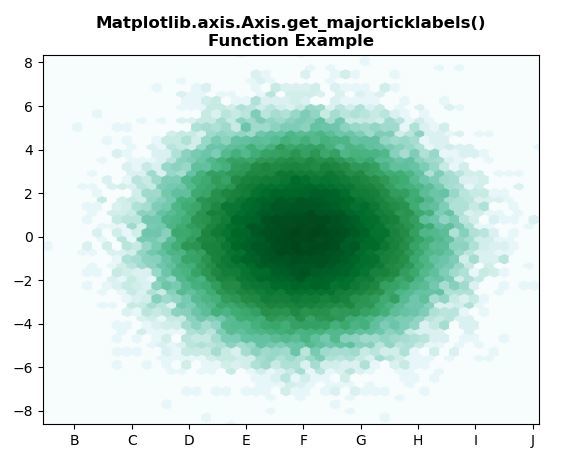
Value of get_majorticklabels():
Text(0, 0, 'A')
Text(0, 0, 'B')
Text(0, 0, 'C')
Text(0, 0, 'D')
Text(0, 0, 'E')
Text(0, 0, 'F')
Text(0, 0, 'G')
Text(0, 0, 'H')
Text(0, 0, 'I')
Text(0, 0, 'J')
Text(0, 0, 'K')
相關用法
- Python Wand function()用法及代碼示例
- Python str()用法及代碼示例
- Python map()用法及代碼示例
- Python now()用法及代碼示例
- Python ord()用法及代碼示例
- Python int()用法及代碼示例
- Python id()用法及代碼示例
- Python hex()用法及代碼示例
- Python oct()用法及代碼示例
- Python tell()用法及代碼示例
- Python dir()用法及代碼示例
- Python cmp()用法及代碼示例
- Python sum()用法及代碼示例
- Python compile()用法及代碼示例
- Python randint()用法及代碼示例
- Python cmath.tan()用法及代碼示例
注:本文由純淨天空篩選整理自SHUBHAMSINGH10大神的英文原創作品 Matplotlib.axis.Axis.get_majorticklabels() function in Python。非經特殊聲明,原始代碼版權歸原作者所有,本譯文未經允許或授權,請勿轉載或複製。