Matplotlib是Python中的一個庫,它是數字的-NumPy庫的數學擴展。它是Python中令人驚歎的可視化庫,用於數組的2D圖,並用於與更廣泛的SciPy堆棧配合使用。
Matplotlib.axis.Axis.get_major_ticks()函數
matplotlib庫的軸模塊中的Axis.get_major_ticks()函數用於獲取刻度實例。
用法: Axis.get_major_ticks(self, numticks=None)
參數:此方法接受以下參數。
- numticks:此參數是刻度數。
返回值:此方法返回刻度實例。
以下示例說明了matplotlib.axis中的matplotlib.axis.Axis.get_major_ticks()函數:
範例1:
Python3
# Implementation of matplotlib function
import numpy as np
from matplotlib.axis import Axis
import matplotlib.pyplot as plt
import matplotlib.ticker as ticker

np.random.seed(19680801)

fig, ax = plt.subplots()
ax.plot(100*np.random.rand(20))

formatter = ticker.FormatStrFormatter('%1.2f')
Axis.set_major_formatter(ax.yaxis, formatter)

print("Value of get_major_ticks():")
for tick in ax.yaxis.get_major_ticks(2):
    tick.label1.set_color('green')
    print(tick)

plt.title("Matplotlib.axis.Axis.get_major_ticks()\n\
Function Example", fontsize = 12, fontweight ='bold')

plt.show()
輸出:
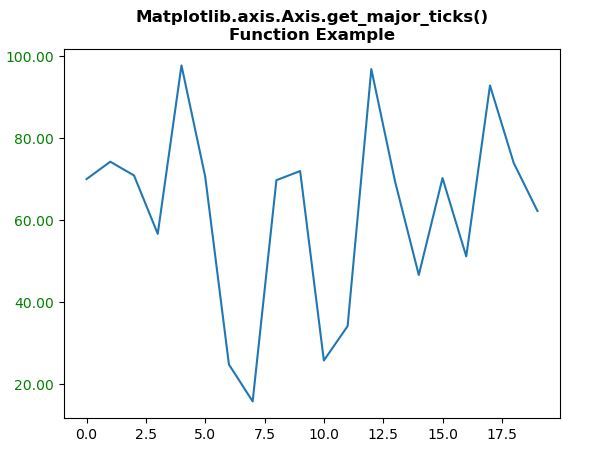
Value of get_major_ticks():
<matplotlib.axis.XTick object at 0x08A46250>
<matplotlib.axis.XTick object at 0x08A46230>
範例2:
Python3
# Implementation of matplotlib function
import numpy as np
from matplotlib.axis import Axis
import matplotlib.pyplot as plt
import matplotlib.ticker as ticker

np.random.seed(19680801)

fig, ax = plt.subplots()
ax.plot(100*np.random.rand(20))

formatter = ticker.FormatStrFormatter('%1.2f')
Axis.set_major_formatter(ax.yaxis, formatter)

print("Value of get_major_ticks():")
for tick in ax.xaxis.get_major_ticks():
    tick.label1.set_color('red')
    print(tick)

plt.title("Matplotlib.axis.Axis.get_major_ticks()\n\
Function Example", fontsize = 12, fontweight ='bold')

plt.show()
輸出:
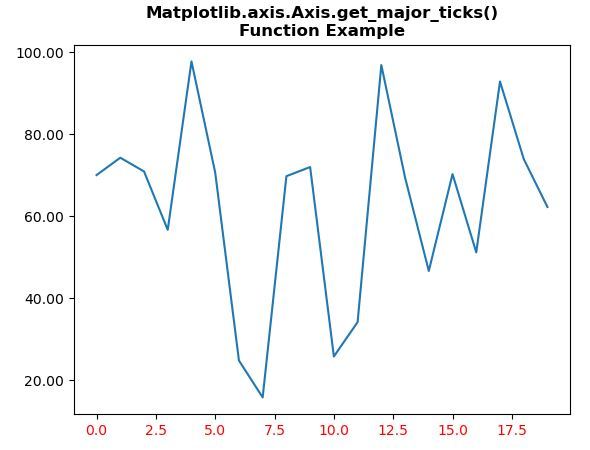
Value of get_major_ticks():
<matplotlib.axis.YTick object at 0x07EB79F0>
<matplotlib.axis.YTick object at 0x07EB7670>
<matplotlib.axis.YTick object at 0x07EA8EB0>
<matplotlib.axis.YTick object at 0x090A30B0>
<matplotlib.axis.YTick object at 0x090A32D0>
<matplotlib.axis.YTick object at 0x090A3570>
<matplotlib.axis.YTick object at 0x090A3830>
相關用法
- Python Wand function()用法及代碼示例
- Python hex()用法及代碼示例
- Python id()用法及代碼示例
- Python dir()用法及代碼示例
- Python str()用法及代碼示例
- Python sum()用法及代碼示例
- Python int()用法及代碼示例
- Python cmp()用法及代碼示例
- Python oct()用法及代碼示例
- Python tell()用法及代碼示例
- Python ord()用法及代碼示例
- Python now()用法及代碼示例
- Python map()用法及代碼示例
- Python math.cos()用法及代碼示例
- Python cmath.tan()用法及代碼示例
- Python Wand fx()用法及代碼示例
注:本文由純淨天空篩選整理自SHUBHAMSINGH10大神的英文原創作品 Matplotlib.axis.Axis.get_major_ticks() function in Python。非經特殊聲明,原始代碼版權歸原作者所有,本譯文未經允許或授權,請勿轉載或複製。