Matplotlib是Python中的一個庫,它是數字的-NumPy庫的數學擴展。它是Python中令人驚歎的可視化庫,用於數組的2D圖,並用於與更廣泛的SciPy堆棧配合使用。
Matplotlib.axis.Axis.get_label()函數
matplotlib庫的axis模塊中的Axis.get_label()函數用於獲取圖例中用於該藝術家的標簽。
用法: Axis.get_label(self)
參數:此方法不接受任何參數。
返回值:此方法返回圖例中用於該藝術家的標簽。
以下示例說明了matplotlib.axis中的matplotlib.axis.Axis.get_label()函數:
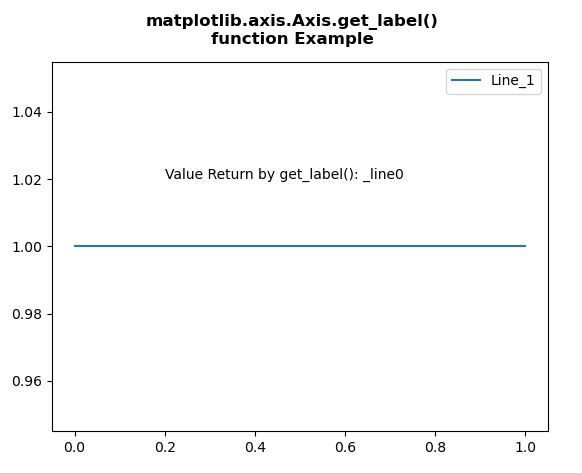
範例1:
Python3
# Implementation of matplotlib function
from matplotlib.axis import Axis
import matplotlib.pyplot as plt


fig, ax = plt.subplots()

x = [0, 1]
y = [1, 1]
line, = ax.plot(x, y)

ax.legend(("Line_1", ))

ax.text(0.2, 1.02, "Value Return by get_label()\
:" + str(line.get_label()))

fig.suptitle("""matplotlib.axis.Axis.get_label()
function Example\n""", fontweight ="bold")

plt.show()
輸出:
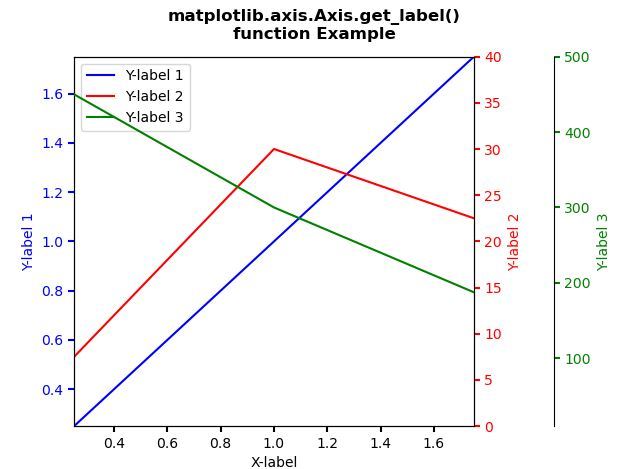
範例2:
Python3
# Implementation of matplotlib function
from matplotlib.axis import Axis
import matplotlib.pyplot as plt


def make_patch_spines_invisible(ax):
    ax.set_frame_on(True)
    ax.patch.set_visible(False)
    for sp in ax.spines.values():
        sp.set_visible(False)


fig, host = plt.subplots()
fig.subplots_adjust(right = 0.75)

par1 = host.twinx()
par2 = host.twinx()

par2.spines["right"].set_position(("axes", 1.2))

make_patch_spines_invisible(par2)

par2.spines["right"].set_visible(True)

p1, = host.plot([0, 1, 2], [0, 1, 2],
                "b-", label ="Y-label 1")
p2, = par1.plot([0, 1, 2], [0, 30, 20],
                "r-", label ="Y-label 2")
p3, = par2.plot([0, 1, 2], [500, 300, 150],
                "g-", label ="Y-label 3")

host.set_xlim(0.25, 1.75)
host.set_ylim(0.25, 1.75)
par1.set_ylim(0, 40)
par2.set_ylim(10, 500)

host.set_xlabel("X-label")
host.set_ylabel("Y-label 1")
par1.set_ylabel("Y-label 2")
par2.set_ylabel("Y-label 3")

host.yaxis.label.set_color(p1.get_color())
par1.yaxis.label.set_color(p2.get_color())
par2.yaxis.label.set_color(p3.get_color())

tkw = dict(size = 4, width = 1.5)
host.tick_params(axis ='y',
                 colors = p1.get_color(),
                 **tkw)
par1.tick_params(axis ='y',
                 colors = p2.get_color(),
                 **tkw)
par2.tick_params(axis ='y',
                 colors = p3.get_color(),
                 **tkw)
host.tick_params(axis ='x',
                 **tkw)

lines = [p1, p2, p3]

host.legend(lines, [l.get_label() for l in lines])

fig.suptitle("""matplotlib.axis.Axis.get_label()
function Example\n""", fontweight ="bold")

plt.show()
輸出:
相關用法
- Python Wand function()用法及代碼示例
- Python hex()用法及代碼示例
- Python now()用法及代碼示例
- Python oct()用法及代碼示例
- Python int()用法及代碼示例
- Python id()用法及代碼示例
- Python tell()用法及代碼示例
- Python sum()用法及代碼示例
- Python ord()用法及代碼示例
- Python str()用法及代碼示例
- Python cmp()用法及代碼示例
- Python dir()用法及代碼示例
- Python map()用法及代碼示例
- Python fmod()用法及代碼示例
- Python globals()用法及代碼示例
- Python ldexp()用法及代碼示例
注:本文由純淨天空篩選整理自SHUBHAMSINGH10大神的英文原創作品 Matplotlib.axis.Axis.get_label() function in Python。非經特殊聲明,原始代碼版權歸原作者所有,本譯文未經允許或授權,請勿轉載或複製。