Matplotlib是Python中的一個庫,它是數字的-NumPy庫的數學擴展。它是Python中令人驚歎的可視化庫,用於數組的2D圖,並用於與更廣泛的SciPy堆棧配合使用。
matplotlib.axis.Axis.format_cursor_data()函數
matplotlib庫的軸模塊中的Axis.format_cursor_data()函數用於獲取數據的字符串表示形式。
用法: Axis.format_cursor_data(self, data)
參數:此方法接受以下參數。
- data:此參數是用於使用的數據。
返回值:此方法返回數據的字符串表示形式。
以下示例說明了matplotlib.axis中的matplotlib.axis.Axis.format_cursor_data()函數:
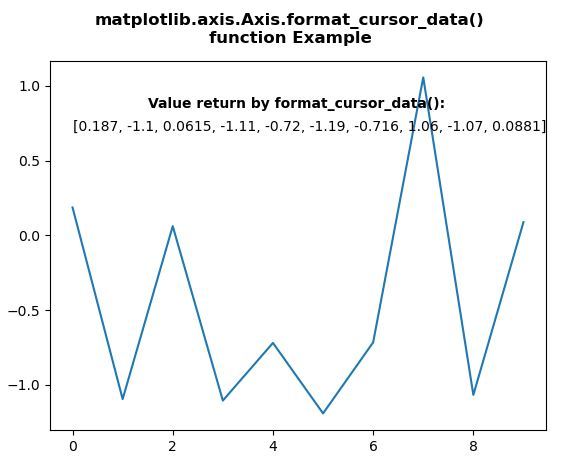
範例1:
Python3
# Implementation of matplotlib function
from matplotlib.axis import Axis
import numpy as np
import matplotlib.pyplot as plt

np.random.seed(10**7)
geeksx = np.random.randn(10)

fig, ax = plt.subplots()
ax.plot(geeksx)

ax.text(1.5, 0.85,
        "Value return by format_cursor_data():",
        fontweight ="bold")

ax.text(0, 0.7,
        Axis.format_cursor_data(ax, data = geeksx))

fig.suptitle("""matplotlib.axis.Axis.format_cursor_data()
function Example\n""", fontweight ="bold")

plt.show()
輸出:
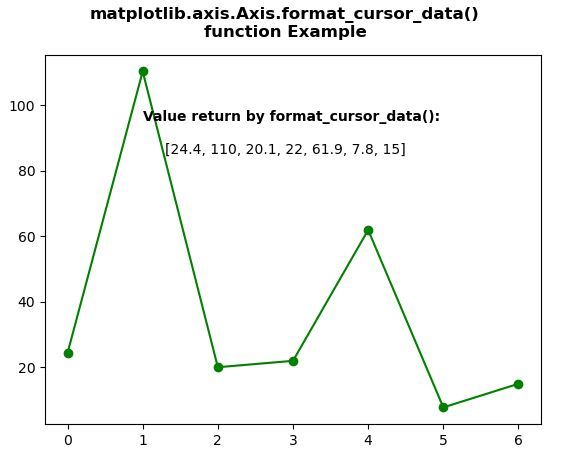
範例2:
Python3
# Implementation of matplotlib function
from matplotlib.axis import Axis
import numpy as np
import matplotlib.pyplot as plt

geeksx = np.array([24.40, 110.25, 20.05,
                   22.00, 61.90, 7.80,
                   15.00])

fig, ax = plt.subplots()
ax.plot(geeksx, 'go-')

ax.text(1, 95,
        "Value return by format_cursor_data():",
        fontweight ="bold")

ax.text(1.3, 85,
        Axis.format_cursor_data(ax,
                                  data = geeksx))

fig.suptitle("""matplotlib.axis.Axis.format_cursor_data()
function Example\n""", fontweight ="bold")

plt.show()
輸出:
相關用法
- Python Wand function()用法及代碼示例
- Python sum()用法及代碼示例
- Python dir()用法及代碼示例
- Python now()用法及代碼示例
- Python id()用法及代碼示例
- Python tell()用法及代碼示例
- Python cmp()用法及代碼示例
- Python hex()用法及代碼示例
- Python ord()用法及代碼示例
- Python oct()用法及代碼示例
- Python int()用法及代碼示例
- Python map()用法及代碼示例
- Python randint()用法及代碼示例
- Python globals()用法及代碼示例
- Python format()用法及代碼示例
- Python fmod()用法及代碼示例
- Python Sorted()用法及代碼示例
注:本文由純淨天空篩選整理自SHUBHAMSINGH10大神的英文原創作品 Matplotlib.axis.Axis.format_cursor_data() function in Python。非經特殊聲明,原始代碼版權歸原作者所有,本譯文未經允許或授權,請勿轉載或複製。