Matplotlib是Python中的一個庫,它是數字的-NumPy庫的數學擴展。它是Python中令人驚歎的可視化庫,用於數組的2D圖,並用於與更廣泛的SciPy堆棧配合使用。
Matplotlib.axis.Axis.draw()函數
matplotlib庫的軸模塊中的Axis.draw()函數用於繪製軸線,網格線,刻度線和標簽。
用法: Axis.draw(self, renderer, \*args, \*\*kwargs)
參數:此方法接受以下參數。
- renderer:此參數是RendererBase子類。
返回值:此方法不返回任何值。
以下示例說明了matplotlib.axis中的matplotlib.axis.Axis.draw()函數:
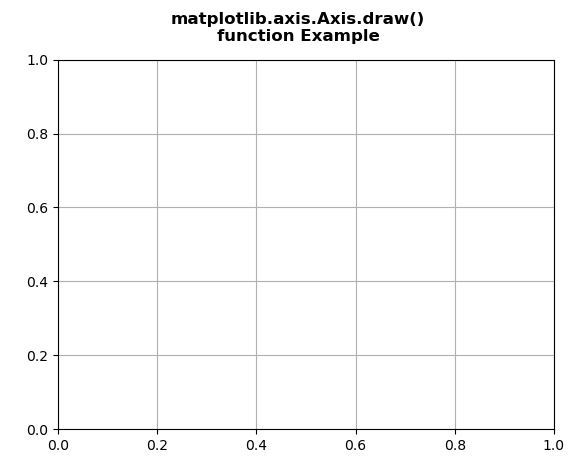
範例1:
Python3
# Implementation of matplotlib function
from matplotlib.axis import Axis
from mpl_toolkits.mplot3d import axes3d
import matplotlib.pyplot as plt

fig, ax = plt.subplots()

def tellme(s):
    fig.canvas.draw()
    renderer = fig.canvas.renderer
    Axis.draw(ax, renderer)

ax.grid()

fig.suptitle("""matplotlib.axis.Axis.draw()
function Example\n""", fontweight ="bold")

plt.show()
輸出:
範例2:
Python3
# Implementation of matplotlib function
from matplotlib.axis import Axis
from mpl_toolkits.mplot3d import axes3d
import matplotlib.pyplot as plt


fig = plt.figure()
ax = fig.add_subplot(111, projection ='3d')

X, Y, Z = axes3d.get_test_data(0.1)
ax.plot_wireframe(X, Y, Z, rstride = 5,
                  cstride = 5)


ax.view_init(30, 60)
fig.canvas.draw()
renderer = fig.canvas.renderer
ax.draw(renderer)

ax.grid()

fig.suptitle("""matplotlib.axis.Axis.draw()
function Example\n""", fontweight ="bold")

plt.show()
輸出:
相關用法
- Python Wand function()用法及代碼示例
- Python ord()用法及代碼示例
- Python sum()用法及代碼示例
- Python cmp()用法及代碼示例
- Python tell()用法及代碼示例
- Python dir()用法及代碼示例
- Python oct()用法及代碼示例
- Python id()用法及代碼示例
- Python int()用法及代碼示例
- Python hex()用法及代碼示例
- Python str()用法及代碼示例
- Python map()用法及代碼示例
- Python now()用法及代碼示例
- Python seek()用法及代碼示例
- Python strftime()用法及代碼示例
- Python randint()用法及代碼示例
- Python numpy.ma.where()用法及代碼示例
注:本文由純淨天空篩選整理自SHUBHAMSINGH10大神的英文原創作品 Matplotlib.axis.Axis.draw() function in Python。非經特殊聲明,原始代碼版權歸原作者所有,本譯文未經允許或授權,請勿轉載或複製。