Matplotlib是Python中的一個庫,它是數字的-NumPy庫的數學擴展。它是Python中令人驚歎的可視化庫,用於數組的2D圖,並用於與更廣泛的SciPy堆棧配合使用。
matplotlib.axis.Axis.cla()函數
matplotlib庫的軸模塊中的Axis.cla()函數用於清除該軸。
用法: Axis.cla(self)
參數:此方法不接受任何參數。
返回值:此方法不返回任何值。
以下示例說明了matplotlib.axis中的matplotlib.axis.Axis.cla()函數:
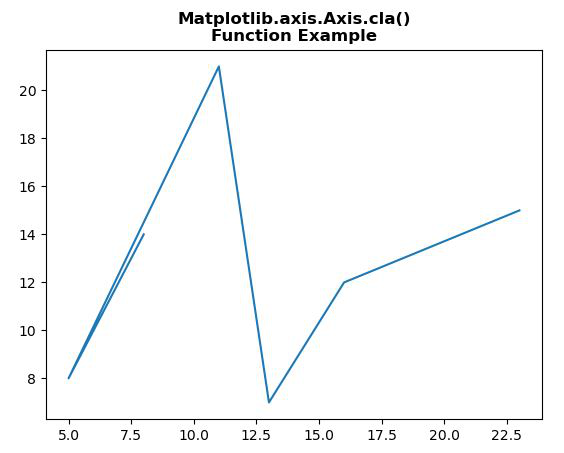
範例1:
Python3
# Implementation of matplotlib function
from matplotlib.axis import Axis
from matplotlib.artist import Artist
import matplotlib.pyplot as plt

# providing values to x and y
x = [8, 5, 11, 13, 16, 23]
y = [14, 8, 21, 7, 12, 15]

fig, ax = plt.subplots()
ax.plot(x, y)
ax.set_xlabel("X-axis")
ax.set_ylabel("Y-axis")

Axis.cla(ax.xaxis)
Axis.cla(ax.yaxis)

plt.title("Matplotlib.axis.Axis.cla()\n\
Function Example", fontsize = 12, fontweight ='bold')
plt.show()
輸出:
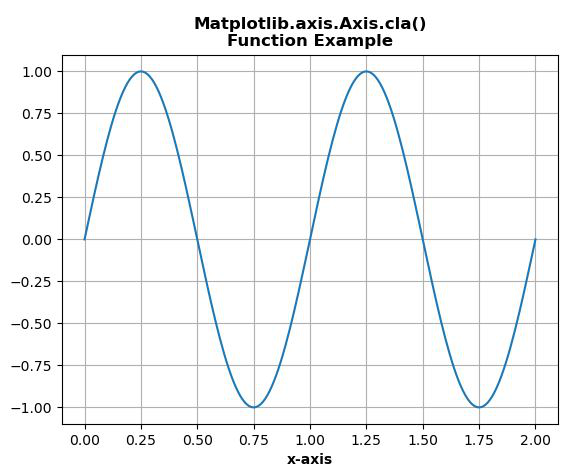
範例2:
Python3
# Implementation of matplotlib function
import numpy as np
from matplotlib.axis import Axis
import matplotlib.pyplot as plt

t = np.linspace(0.0, 2.0, 201)
s = np.sin(2 * np.pi * t)

fig, ax= plt.subplots()

ax.plot(t, s)
ax.grid(True)
ax.set_ylabel('y-axis', fontweight ='bold')
ax.set_xlabel('x-axis', fontweight ='bold')

Axis.cla(ax.yaxis)

plt.title("Matplotlib.axis.Axis.cla()\n\
Function Example", fontsize = 12, fontweight ='bold')
plt.show()
輸出:
相關用法
- Python Wand function()用法及代碼示例
- Python dir()用法及代碼示例
- Python now()用法及代碼示例
- Python ord()用法及代碼示例
- Python tell()用法及代碼示例
- Python id()用法及代碼示例
- Python map()用法及代碼示例
- Python cmp()用法及代碼示例
- Python int()用法及代碼示例
- Python oct()用法及代碼示例
- Python hex()用法及代碼示例
- Python sum()用法及代碼示例
- Python str()用法及代碼示例
- Python cmath.sin()用法及代碼示例
- Python cmath.tan()用法及代碼示例
- Python numpy.ix_()用法及代碼示例
注:本文由純淨天空篩選整理自SHUBHAMSINGH10大神的英文原創作品 Matplotlib.axis.Axis.cla() function in Python。非經特殊聲明,原始代碼版權歸原作者所有,本譯文未經允許或授權,請勿轉載或複製。