Matplotlib是Python中的一個庫,它是數字的-NumPy庫的數學擴展。軸類包含大多數圖形元素:Axis,Tick,Line2D,Text,Polygon等,並設置坐標係。 Axes實例通過callbacks屬性支持回調。
matplotlib.axes.Axes.streamplot()函數
matplotlib庫的axiss模塊中的Axes.streamplot()函數也用於繪製矢量流的流線。
用法: Axes.streamplot(axes, x, y, u, v, density=1, linewidth=None, color=None, cmap=None, norm=None, arrowsize=1, arrowstyle=’-|>’, minlength=0.1, transform=None, zorder=None, start_points=None, maxlength=4.0, integration_direction=’both’, *, data=None)
參數:此方法接受以下描述的參數:
- X, Y:這些參數是均勻間隔的網格的x和y坐標。
- U, V:行和列的數量必須與y和x的長度匹配。
- density:此參數用於控製流線的緊密度。
- linewidth:此參數是流線的寬度。
- color:此參數是流線顏色。
- cmap:此參數用於繪製流線和箭頭。
- norm:此參數用於歸一化用於將亮度數據縮放為0、1的對象。
- arrowsize:此參數是箭頭大小的縮放比例。
- minlength:此參數是軸坐標中流線的最小長度。
- maxlength:此參數是軸坐標中流線的最大長度。
- zorder:此參數是流線和箭頭的zorder。
返回值:此方法返回以下內容:
- stream_container:這將返回帶有屬性的StreamplotSet容器對象
以下示例說明了matplotlib.axes中的matplotlib.axes.Axes.streamplot()函數:
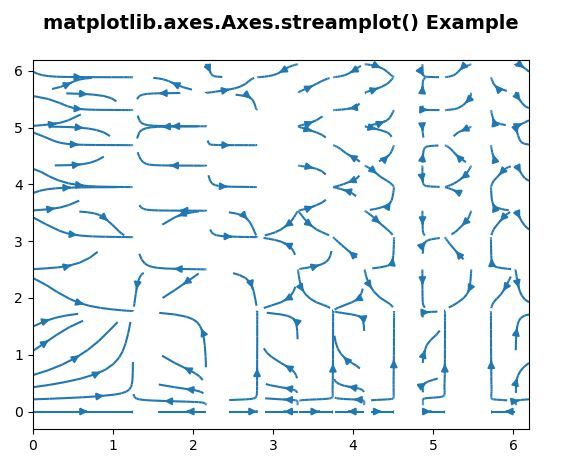
範例1:
# Implementation of matplotlib function
import matplotlib.pyplot as plt
import numpy as np

X, Y = np.meshgrid(np.arange(0, 2 * np.pi, .2),
                   np.arange(0, 2 * np.pi, .2))
U = np.cos(X**2)
V = np.sin(Y**2)

fig, ax = plt.subplots()
ax.streamplot(X, Y, U, V, density =[0.5, 1])

ax.set_title('matplotlib.axes.Axes.streamplot()\
 Example\n', fontsize = 14, fontweight ='bold')
plt.show()
輸出:
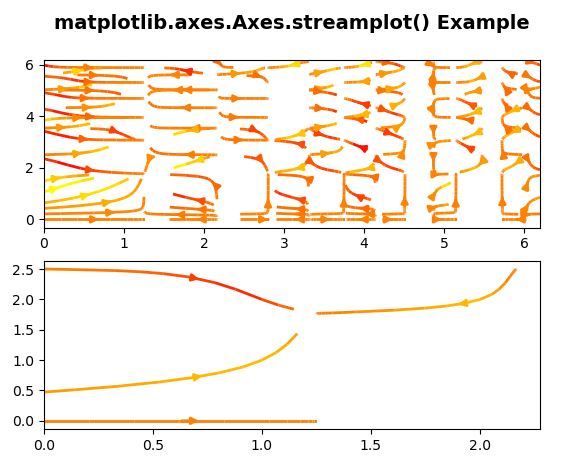
範例2:
# Implementation of matplotlib function


import matplotlib.pyplot as plt
import numpy as np

X, Y = np.meshgrid(np.arange(0, 2 * np.pi, .2),
                   np.arange(0, 2 * np.pi, .2))
U = np.cos(X**2)
V = np.sin(Y**2)

fig, (ax, ax1)= plt.subplots(nrows = 2, ncols = 1)
ax.streamplot(X, Y, U, V, density =[0.5, 1],
             color = V * U, linewidth = 2,
             cmap ='autumn')
val = np.array([[2, 1, 0, 1, 2, 1],
                [2, 1,  0, 1, 2, 2]])

ax1.streamplot(X, Y, U, V, color = V * U, linewidth = 2,
               cmap ='autumn',
               start_points = val.T)

ax.set_title('matplotlib.axes.Axes.streamplot() \
Example\n', fontsize = 14, fontweight ='bold')
plt.show()
輸出:
相關用法
注:本文由純淨天空篩選整理自SHUBHAMSINGH10大神的英文原創作品 Matplotlib.axes.Axes.streamplot() in Python。非經特殊聲明,原始代碼版權歸原作者所有,本譯文未經允許或授權,請勿轉載或複製。