Matplotlib是Python中的一個庫,它是數字的-NumPy庫的數學擴展。軸類包含大多數圖形元素:Axis,Tick,Line2D,Text,Polygon等,並設置坐標係。 Axes實例通過callbacks屬性支持回調。
matplotlib.axes.Axes.set_xscale()函數
matplotlib庫的axiss模塊中的Axes.set_xscale()函數用於設置x軸比例。
用法: Axes.set_xscale(self, value, **kwargs)
參數:此方法接受以下參數。
- value:此參數是要應用的軸比例類型。
- **kwargs:有不同的關鍵字參數可以接受,並且取決於規模。
以下示例說明了matplotlib.axes中的matplotlib.axes.Axes.set_xscale()函數:
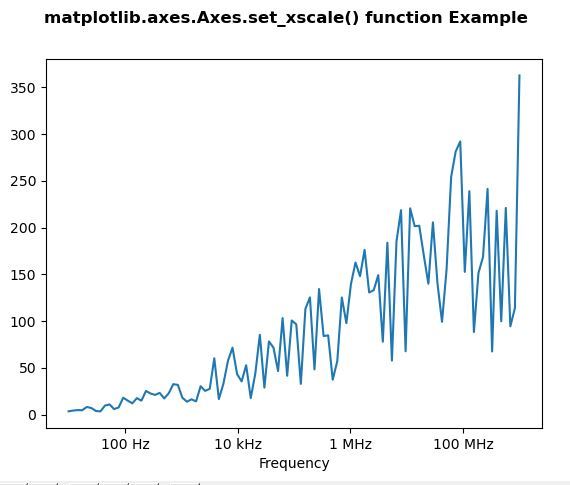
範例1:
# Implementation of matplotlib function
import matplotlib.pyplot as plt
import numpy as np
from matplotlib.ticker import EngFormatter

val = np.random.RandomState(19680801)
xs = np.logspace(1, 9, 100)
ys = (0.8 + 4 * val.uniform(size = 100)) * np.log10(xs)**2

fig, ax0 = plt.subplots()
ax0.set_xscale('log')
formatter0 = EngFormatter(unit ='Hz')
ax0.xaxis.set_major_formatter(formatter0)
ax0.plot(xs, ys)
ax0.set_xlabel('Frequency')

fig.suptitle('matplotlib.axes.Axes.set_xscale() \
function Example\n', fontweight ="bold")

plt.show()
輸出:
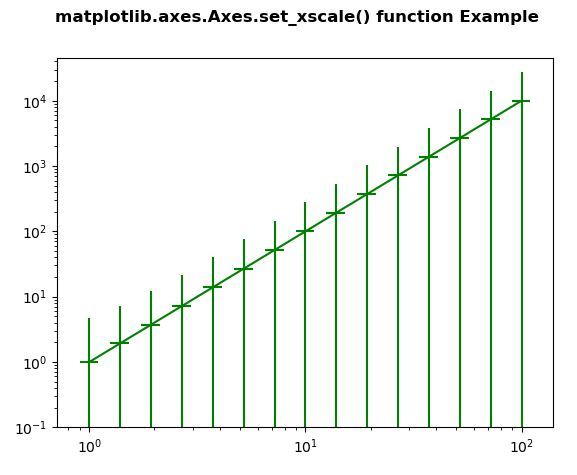
範例2:
# Implementation of matplotlib function
import numpy as np
import matplotlib.pyplot as plt


fig, ax4 = plt.subplots()

x = 10.0**np.linspace(0.0, 2.0, 15)
y = x**2.0
ax4.set_xscale("log", nonposx ='clip')
ax4.set_yscale("log", nonposy ='clip')

ax4.errorbar(x, y, xerr = 0.1 * x,
             yerr = 2.0 + 1.75 * y,
             color ="green")

ax4.set_ylim(bottom = 0.1)

fig.suptitle('matplotlib.axes.Axes.set_xscale()\
 function Example\n', fontweight ="bold")

plt.show()
輸出:
相關用法
注:本文由純淨天空篩選整理自SHUBHAMSINGH10大神的英文原創作品 Matplotlib.axes.Axes.set_xscale() in Python。非經特殊聲明,原始代碼版權歸原作者所有,本譯文未經允許或授權,請勿轉載或複製。