Matplotlib是Python中的一個庫,它是數字的-NumPy庫的數學擴展。軸類包含大多數圖形元素:Axis,Tick,Line2D,Text,Polygon等,並設置坐標係。 Axes實例通過callbacks屬性支持回調。
matplotlib.axes.Axes.set_xlim()函數:
matplotlib庫的axiss模塊中的Axes.set_xlim()函數用於設置x軸視圖限製。
用法: Axes.set_xlim(self, left=None, right=None, emit=True, auto=False, *, xmin=None, xmax=None)
參數:此方法接受以下參數。
- left:此參數是數據坐標中的左側xlim
- right:此參數是數據坐標中正確的xlim
- emit:此參數用於將限製更改通知觀察者。
- auto:此參數用於打開x軸的自動縮放。
- xmin, xmax:這些參數等效於left和right,同時傳遞xmin和left或xmax和right都是錯誤的。
返回值:此方法返回以下內容
- 左右:這將返回數據坐標中的新x軸限製。
以下示例說明了matplotlib.axes中的matplotlib.axes.Axes.set_xlim()函數:
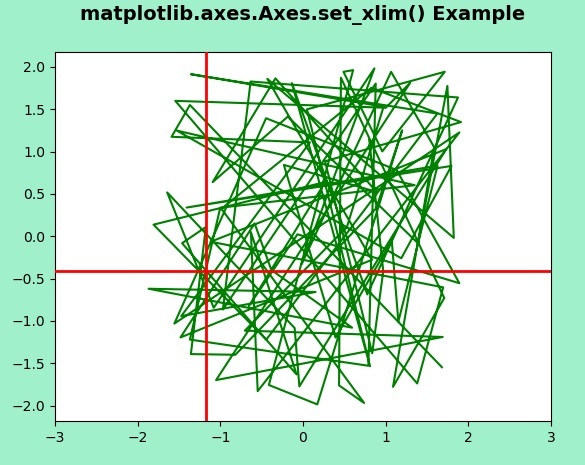
範例1:
# Implementation of matplotlib function
from matplotlib.widgets import Cursor
import numpy as np
import matplotlib.pyplot as plt


np.random.seed(19680801)

fig, ax = plt.subplots(facecolor ='#A0F0CC')

x, y = 4*(np.random.rand(2, 100) - .5)
ax.plot(x, y, 'g')
ax.set_xlim(-3, 3)

cursor = Cursor(ax, useblit = True, color ='red',
                linewidth = 2)

ax.set_title('matplotlib.axes.Axes.set_xlim() \
Example\n', fontsize = 14, fontweight ='bold')
plt.show()
輸出:
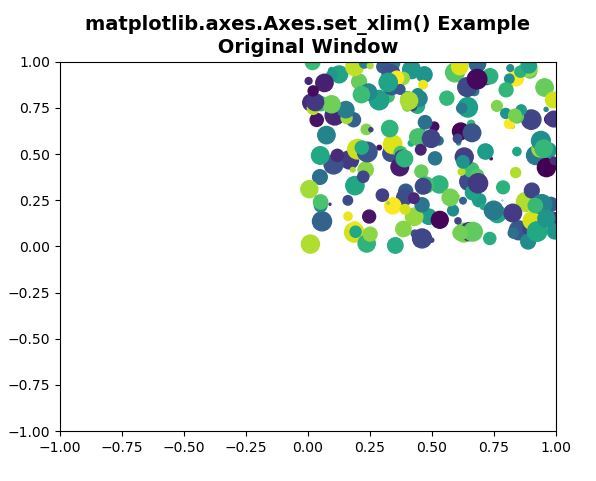
範例2:
# Implementation of matplotlib function
import matplotlib.pyplot as plt
import numpy as np
fig1, ax1 = plt.subplots()
fig2, ax2 = plt.subplots()
ax1.set(xlim =(-1.0, 1.0),
ylim =(-1.0, 1.0),
autoscale_on = False)
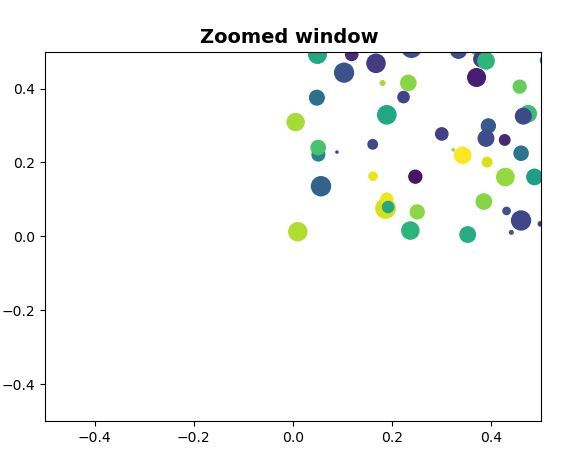
ax2.set(xlim =(-0.5, 0.5),
ylim =(-0.5, 0.5),
autoscale_on = False)
x, y, s, c = np.random.rand(4, 200)
s *= 200
ax1.scatter(x, y, s, c)
ax2.scatter(x, y, s, c)
def GFG(event):
if event.button != 1:
return
x, y = event.xdata, event.ydata
ax2.set_xlim(x - 0.5, x + 0.5)
ax2.set_ylim(y - 0.5, y + 0.5)
fig2.canvas.draw()
fig1.canvas.mpl_connect('button_press_event',
GFG)
ax1.set_title('matplotlib.axes.Axes.set_xlim() \
Example\n Original Window ',
fontsize = 14, fontweight ='bold')
ax2.set_title('Zoomed Window',
fontsize = 14, fontweight ='bold')
plt.show()輸出:
相關用法
注:本文由純淨天空篩選整理自SHUBHAMSINGH10大神的英文原創作品 Matplotlib.axes.Axes.set_xlim() in Python。非經特殊聲明,原始代碼版權歸原作者所有,本譯文未經允許或授權,請勿轉載或複製。