Matplotlib是Python中的一個庫,它是數字的-NumPy庫的數學擴展。軸類包含大多數圖形元素:Axis,Tick,Line2D,Text,Polygon等,並設置坐標係。 Axes實例通過callbacks屬性支持回調。
matplotlib.axes.Axes.set_prop_cycle()函數
matplotlib庫的axiss模塊中的Axes.set_prop_cycle()函數用於設置軸的屬性周期。
用法: Axes.set_prop_cycle(self, *args, **kwargs)
參數:此方法接受以下參數。
- cycler:此參數用於設置給定的Cycler。
- label:此參數是屬性鍵。
- values:此參數是屬性值的finite-length迭代。
返回值:此方法不返回任何值。
以下示例說明了matplotlib.axes中的matplotlib.axes.Axes.set_prop_cycle()函數:
範例1:
# Implementation of matplotlib function
from cycler import cycler
import numpy as np
import matplotlib.pyplot as plt
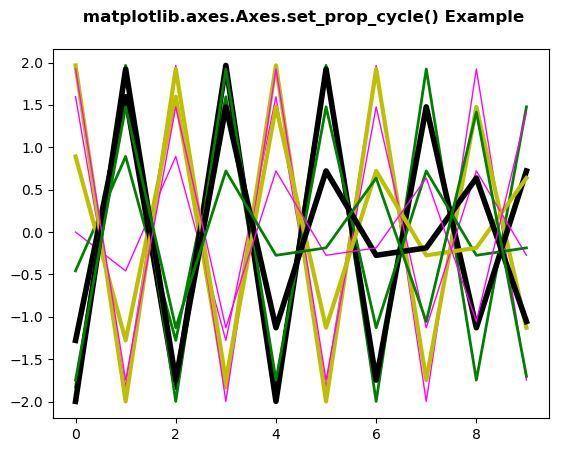
x = np.linspace(0, 200, 10)
yy = np.transpose([2 * np.sin(x + phi) for phi in x])
fig, ax1 = plt.subplots()
ax1.set_prop_cycle(color =['magenta', 'g',
'y', 'k'],
lw =[1, 2, 3, 4])
ax1.plot(yy)
ax1.set_title(' matplotlib.axes.Axes.set_prop_cycle() \
Example\n', fontsize = 12, fontweight ='bold')
plt.show()輸出:
範例2:
# Implementation of matplotlib function
from cycler import cycler
import numpy as np
import matplotlib.pyplot as plt

x = np.linspace(0, 3 * np.pi)

offsets = np.linspace(0, 3 * np.pi, 8,
                      endpoint = False)

yy = np.transpose([2 * np.sin(x + phi) for phi in offsets])

plt.rc('lines', linewidth = 4)
plt.rc('axes', prop_cycle =(cycler(color =['r', 'g',
                                           'purple',
                                           'orange']) +
                           cycler(linestyle =['-',
                                              '--',
                                              ':',
                                              '-.'])))

fig, (ax0, ax1) = plt.subplots(nrows = 2)
ax0.plot(yy)
ax0.set_title('Above example with set_prop_cycle() \
function\n\nSet default color cycle to rgby',
              fontsize = 12, fontweight ='bold')

ax1.set_prop_cycle(color =['magenta', 'g',
                           'y', 'k'],
                   lw =[1, 2, 3, 4])
ax1.plot(yy)
ax1.set_title('Set axes color cycle to cmyk',
              fontsize = 12,
              fontweight ='bold')

plt.show()
輸出:

相關用法
注:本文由純淨天空篩選整理自SHUBHAMSINGH10大神的英文原創作品 Matplotlib.axes.Axes.set_prop_cycle() in Python。非經特殊聲明,原始代碼版權歸原作者所有,本譯文未經允許或授權,請勿轉載或複製。