Matplotlib是Python中的一個庫,它是數字的-NumPy庫的數學擴展。軸類包含大多數圖形元素:Axis,Tick,Line2D,Text,Polygon等,並設置坐標係。 Axes實例通過callbacks屬性支持回調。
matplotlib.axes.Axes.set_position()函數
matplotlib庫的軸模塊中的Axes.set_position()函數用於設置軸位置。
用法: Axes.set_position(self)
參數:此方法接受以下參數。
- pos:此參數是圖形坐標中的新位置。
- which:該參數用於確定要更改的位置變量。
返回值:此方法不返回任何值。
以下示例說明了matplotlib.axes中的matplotlib.axes.Axes.set_position()函數:
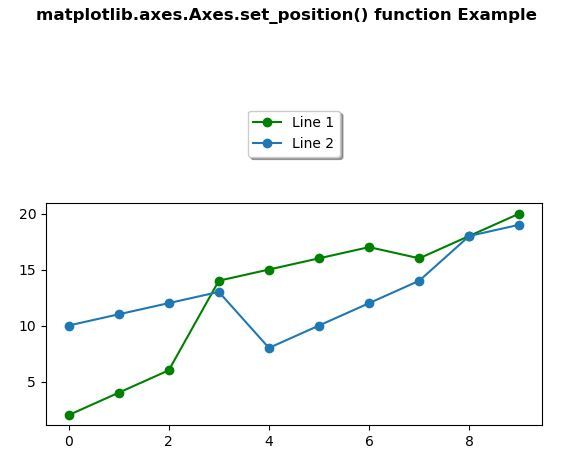
範例1:
# Implementation of matplotlib function
import matplotlib.pyplot as plt
import numpy as np

x = np.arange(10)
y = [2, 4, 6, 14, 15, 16, 17,
     16, 18, 20]
y2 = [10, 11, 12, 13, 8, 10,
      12, 14, 18, 19]

fig, ax = plt.subplots()

ax.plot(x, y, "go-", label ='Line 1', )
ax.plot(x, y2, "o-", label ='Line 2')

chartBox = ax.get_position()
ax.set_position([chartBox.x0, chartBox.y0,
                 chartBox.width,
                 chartBox.height * 0.6])

ax.legend(loc ='upper center',
          bbox_to_anchor =(0.5, 1.45),
          shadow = True, ncol = 1)

fig.suptitle('matplotlib.axes.Axes.set_position()\
function Example', fontweight ="bold")
plt.show()
輸出:
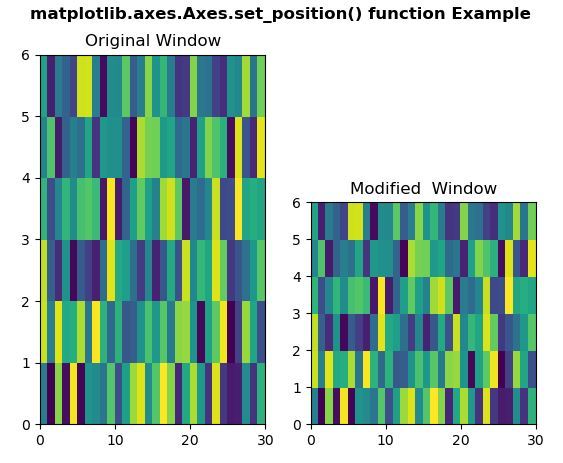
範例2:
# Implementation of matplotlib function
import matplotlib.pyplot as plt
import numpy as np
from matplotlib.colors import LogNorm

Z = np.random.rand(6, 30)

fig, (ax, ax1) = plt.subplots(1, 2)

ax.pcolor(Z)
ax1.pcolor(Z)

chartBox = ax1.get_position()
ax1.set_position([chartBox.x0,
                  chartBox.y0,
                  chartBox.width,
                  chartBox.height * 0.6])

ax.set_title("Original Window")
ax1.set_title("Modified  Window")

fig.suptitle('matplotlib.axes.Axes.set_position()\
function Example', fontweight ="bold")
plt.show()
輸出:
注:本文由純淨天空篩選整理自SHUBHAMSINGH10大神的英文原創作品 Matplotlib.axes.Axes.set_position() in Python。非經特殊聲明,原始代碼版權歸原作者所有,本譯文未經允許或授權,請勿轉載或複製。