Matplotlib是Python中的一個庫,它是數字的-NumPy庫的數學擴展。軸類包含大多數圖形元素:Axis,Tick,Line2D,Text,Polygon等,並設置坐標係。 Axes實例通過callbacks屬性支持回調。
matplotlib.axes.Axes.set_clip_on()函數
matplotlib庫的axiss模塊中的Axes.set_clip_on()函數用於設置藝術家是否使用剪輯。
用法: Axes.set_clip_on(self, b)
參數:此方法僅接受一個參數。
- b:此參數包含布爾值。
返回值:此方法不返回任何值。
以下示例說明了matplotlib.axes中的matplotlib.axes.Axes.set_clip_on()函數:
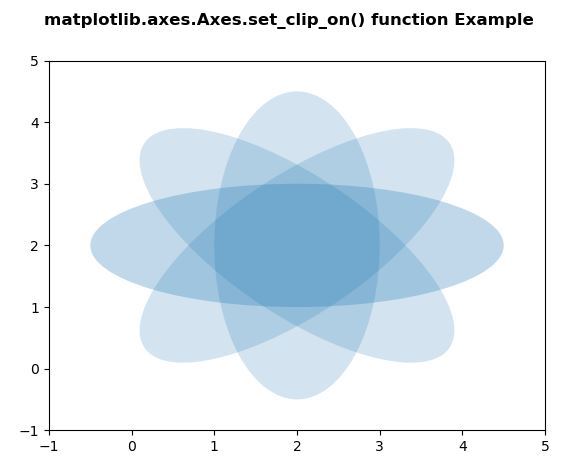
範例1:
# Implementation of matplotlib function
import matplotlib.pyplot as plt
import numpy as np
from matplotlib.patches import Ellipse

delta = 45.0

angles = np.arange(0, 360 + delta, delta)
ells = [Ellipse((2, 2), 5, 2, a) for a in angles]

fig, ax = plt.subplots()

for e in ells:
    e.set_alpha(0.1)
    ax.add_artist(e)

ax.set_xlim(-1, 5)
ax.set_ylim(-1, 5)
ax.set_clip_on(False)

fig.suptitle('matplotlib.axes.Axes.set_clip_on()\
 function Example\n\n', fontweight ="bold")

plt.show()
輸出:
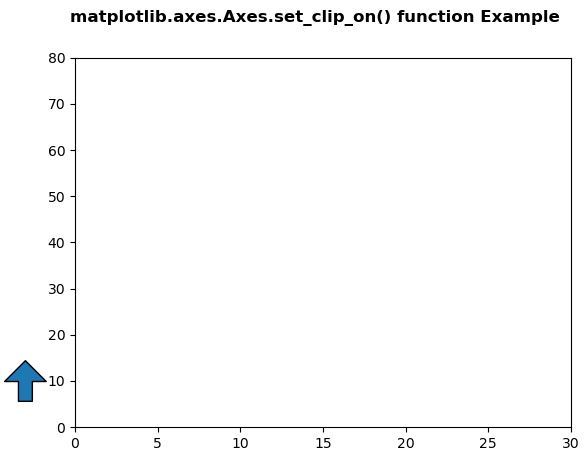
範例2:
# Implementation of matplotlib function
import matplotlib.pyplot as plt
import matplotlib.patches as mpatches
import matplotlib.transforms as mtransforms


x0 = -0.1

arrow_style ="simple, head_length = 15,\
 head_width = 30, tail_width = 10"
rect_style ="simple, tail_width = 25"
line_style ="simple, tail_width = 1"

fig, ax = plt.subplots()

trans = mtransforms.blended_transform_factory(ax.transAxes, ax.transData)

y_tail = 5
y_head = 15
arrow1 = mpatches.FancyArrowPatch((x0, y_tail),
                                  (x0, y_head),
                                   arrowstyle = arrow_style,
                                   transform = trans)
arrow1.set_clip_on(False)
ax.add_patch(arrow1)

ax.set_xlim(0, 30)
ax.set_ylim(0, 80)

fig.suptitle('matplotlib.axes.Axes.set_clip_on() \
function Example\n\n', fontweight ="bold")

plt.show()
輸出:
相關用法
注:本文由純淨天空篩選整理自SHUBHAMSINGH10大神的英文原創作品 Matplotlib.axes.Axes.set_clip_on() in Python。非經特殊聲明,原始代碼版權歸原作者所有,本譯文未經允許或授權,請勿轉載或複製。