Matplotlib是Python中的一個庫,它是數字的-NumPy庫的數學擴展。軸類包含大多數圖形元素:Axis,Tick,Line2D,Text,Polygon等,並設置坐標係。 Axes實例通過callbacks屬性支持回調。
matplotlib.axes.Axes.margins()函數
matplotlib庫的axiss模塊中的Axes.margins()函數用於設置或檢索自動縮放裕量。
用法: Axes.margins(self, *margins, x=None, y=None, tight=True)
參數:此方法接受以下參數。
- *margins:此參數用於指定x軸限製和y軸限製的邊距。
- x, y:這些參數分別用於x軸和y軸的特定邊距值。
- tight:此參數傳遞給autoscale_view(),該值在更改邊距後執行。
返回值:此方法返回以下值。
- xmargin
- ymargin
以下示例說明了matplotlib.axes中的matplotlib.axes.Axes.margins()函數:
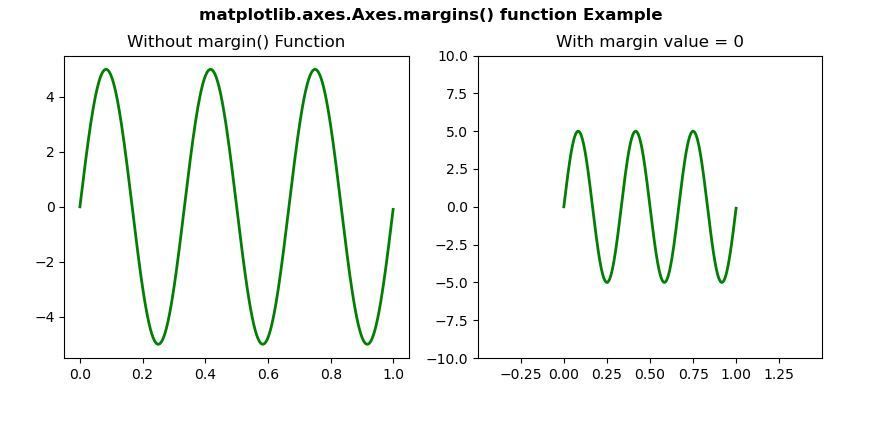
範例1:
# Implementation of matplotlib function
import numpy as np
import matplotlib.pyplot as plt
from matplotlib.widgets import Slider, Button, RadioButtons

fig, (ax, ax1) = plt.subplots(1, 2)
plt.subplots_adjust(bottom = 0.25)
t = np.arange(0.0, 1.0, 0.001)
a0 = 5
f0 = 3
delta_f = 5.0
s = a0 * np.sin(2 * np.pi * f0 * t)
ax.plot(t, s, lw = 2, color = 'green')

ax1.plot(t, s, lw = 2, color = 'green')
ax1.margins(0.5)

ax.set_title("Without margin() Function")
ax1.set_title("With margin value = 0")

fig.suptitle('matplotlib.axes.Axes.margins() function \
Example\n', fontweight ="bold")
fig.canvas.draw()
plt.show()
輸出:
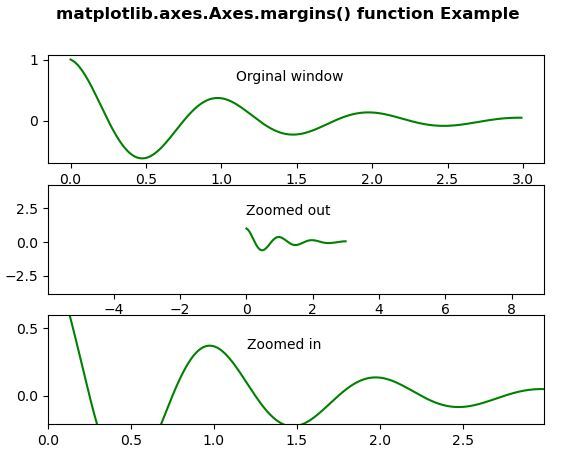
範例2:
# Implementation of matplotlib function
import numpy as np
import matplotlib.pyplot as plt

t = np.arange(0.0, 3.0, 0.01)
t1 = np.exp(-t) * np.cos(2 * np.pi * t)

fig, [ax1, ax2, ax3] = plt.subplots(nrows = 3)
ax1.plot(t, t1, color ="green")
ax1.text(1.1, 0.65, 'Orginal window')

ax2.margins(2, 2)
ax2.plot(t, t1, color ="green")
ax2.text(0, 2.0, 'Zoomed out')

ax3.margins(x = 0, y =-0.25)
ax3.plot(t, t1, color ="green")
ax3.text(1.2, 0.35, 'Zoomed in')

fig.suptitle('matplotlib.axes.Axes.margins() function\
 Example\n', fontweight ="bold")
fig.canvas.draw()
plt.show()
輸出:
相關用法
注:本文由純淨天空篩選整理自SHUBHAMSINGH10大神的英文原創作品 Matplotlib.axes.Axes.margins() in Python。非經特殊聲明,原始代碼版權歸原作者所有,本譯文未經允許或授權,請勿轉載或複製。