Matplotlib是Python中的一個庫,它是數字的-NumPy庫的數學擴展。軸類包含大多數圖形元素:Axis,Tick,Line2D,Text,Polygon等,並設置坐標係。 Axes實例通過callbacks屬性支持回調。
matplotlib.axes.Axes.indicate_inset()函數
matplotlib庫的軸模塊中的Axes.indicate_inset()函數還用於向軸添加插入指示器。
用法: Axes.indicate_inset(self, bounds, inset_ax=None, *, transform=None, facecolor=’none’, edgecolor=’0.5′, alpha=0.5, zorder=4.99, **kwargs)
參數:此方法接受以下描述的參數:
- bounds:此參數是要標記的矩形的Lower-left角及其寬度和高度。[x0,y0,width,height]
- transform:此參數是rect的單位,以axes-relative坐標表示。
- zorder:此參數包含數字,默認值為5。
- inset_ax:該參數是用於繪製連接線的可選插入軸。
- facecolor:此參數用於插入矩形的麵色。
- edgecolor:此參數是矩形的顏色和連接線的顏色。
- alpha:此參數表示矩形和連接線的透明度。
返回值:此方法返回以下內容:
- rectangle_patch:這將返回指示器框架。
- connector_lines:這將返回連接到inset_ax的(lower_left,upper_left,lower_right upper_right)角的四根連接器線。
注意:此函數適用於Matplotlib版本> = 3.0
以下示例說明了matplotlib.axes中的matplotlib.axes.Axes.indicate_inset()函數:
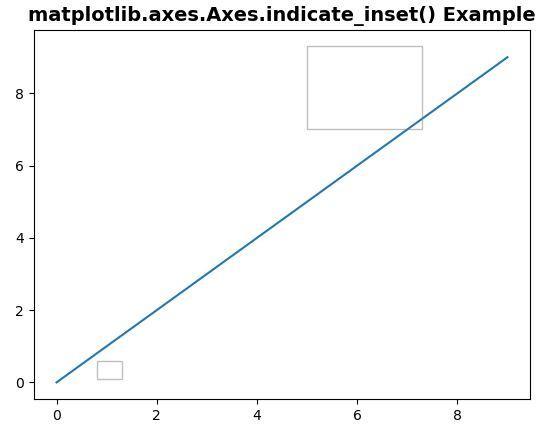
範例1:
# Implementation of matplotlib function
import matplotlib.pyplot as plt

fig, ax = plt.subplots()
ax.plot(range(10))
axin1 = ax.indicate_inset([0.8, 0.1, 0.5, 0.5])
axin2 = ax.indicate_inset(
        [5, 7, 2.3, 2.3], transform = ax.transData)
ax.set_title('matplotlib.axes.Axes.indicate_inset() Example',
             fontsize = 14, fontweight ='bold')
plt.show()
輸出:
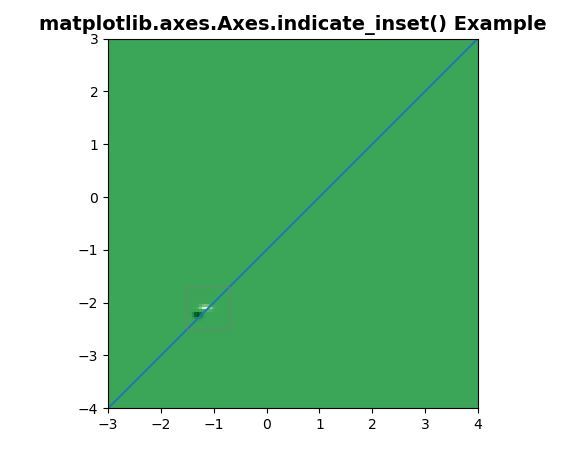
範例2:
# Implementation of matplotlib function
import matplotlib.pyplot as plt
import numpy as np

def geeks():
    from matplotlib.cbook import get_sample_data
    import numpy as np
    f = get_sample_data("axes_grid/bivariate_normal.npy",
                        asfileobj = False)

    z = np.load(f)
    return z, (-3, 4, -4, 3)

fig, ax = plt.subplots()
ax.plot(range(-3, 5), range(-4, 4))
X, extent = geeks()
Z2 = np.zeros([150, 150], dtype ="g")
ny, nx = X.shape
Z2[30:30 + ny, 30:30 + nx] = X

ax.imshow(Z2**3 + 100, extent = extent,
          interpolation ="nearest",
          origin ="lower", cmap ="Greens")

axins, axins1 = ax.indicate_inset([-1.5, -2.5, 0.8, 0.8])

ax.set_title('matplotlib.axes.Axes.indicate_inset() Example',
             fontsize = 14, fontweight ='bold')
plt.show()
輸出:
注:本文由純淨天空篩選整理自SHUBHAMSINGH10大神的英文原創作品 Matplotlib.axes.Axes.indicate_inset() in Python。非經特殊聲明,原始代碼版權歸原作者所有,本譯文未經允許或授權,請勿轉載或複製。