Matplotlib是Python中的一個庫,它是數字的-NumPy庫的數學擴展。軸類包含大多數圖形元素:Axis,Tick,Line2D,Text,Polygon等,並設置坐標係。 Axes實例通過callbacks屬性支持回調。
matplotlib.axes.Axes.has_data()函數
matplotlib庫的axes模塊中的Axes.has_data()函數用於檢查是否已將任何美術師添加到axes。
用法: Axes.has_data(self)
參數:此方法不接受任何參數。
返回:如果已將任何藝術家添加到坐標軸,則此方法返回True。
以下示例說明了matplotlib.axes中的matplotlib.axes.Axes.has_data()函數:
範例1:
# ImpleIn Reviewtation of matplotlib function
import matplotlib.pyplot as plt

fig, ax1 = plt.subplots( )
ax1.set_xscale("log")
ax1.set_yscale("log")
ax1.set_adjustable("datalim")

ax1.plot([1, 3, 34, 4, 46, 3, 7, 45, 10],
         [1, 9, 27, 8, 29, 84, 78, 19, 48],
          "o-", color ="green")

ax1.set_xlim(1e-1, 1e2)
ax1.set_ylim(1, 1e2)

w = ax1.has_data()

print("Value Return by has_data():", w)

fig.suptitle('matplotlib.axes.Axes.has_data()\
 function Example\n\n', fontweight ="bold")

fig.canvas.draw()

plt.show()
輸出:
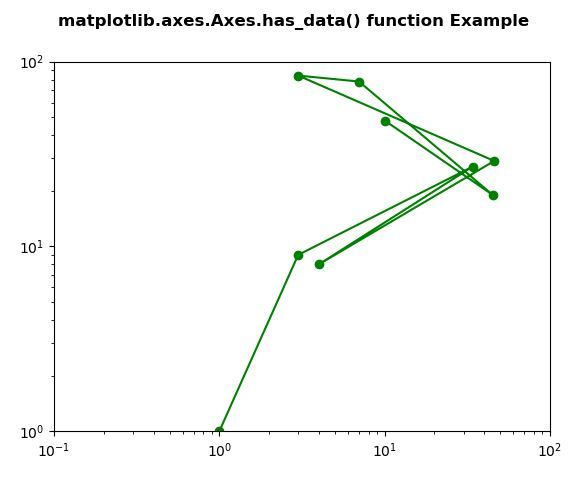
Value Return by has_data():True
範例2:
# ImpleIn Reviewtation of matplotlib function
import matplotlib.pyplot as plt
import matplotlib.tri as tri
import numpy as np

n_angles = 36
n_radii = 10
min_radius = 2
radii = np.linspace(min_radius, 0.95, n_radii)

angles = np.linspace(0, 2 * np.pi, n_angles,
                     endpoint = False)
angles = np.repeat(angles[..., np.newaxis],
                   n_radii, axis = 1)
angles[:, 1::2] += 2 * np.pi / n_angles

x = (radii * np.cos(angles)).flatten()
y = (radii * np.sin(angles)).flatten()

triang = tri.Triangulation(x, y)

triang.set_mask(np.hypot(x[triang.triangles].mean(axis = 1),
                         y[triang.triangles].mean(axis = 1))
                < min_radius)
fig, ax = plt.subplots()

ax.triplot(triang, 'bo-', lw = 1, color = "green")

w = ax.has_data()

print("Value Return by has_data():", w)

fig.suptitle('matplotlib.axes.Axes.has_data() function\
 Example\n\n', fontweight ="bold")

fig.canvas.draw()

plt.show()
輸出:
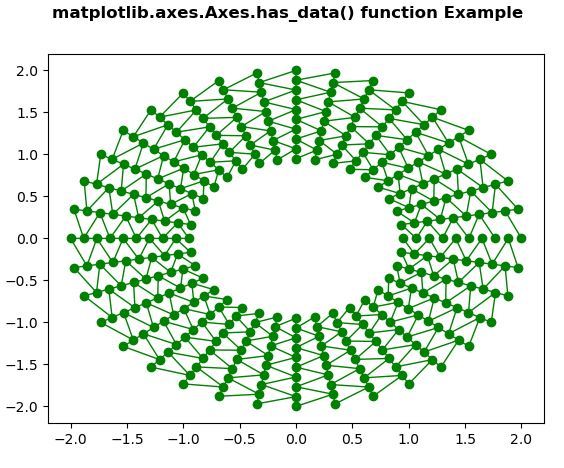
Value Return by has_data():True
相關用法
注:本文由純淨天空篩選整理自SHUBHAMSINGH10大神的英文原創作品 Matplotlib.axes.Axes.has_data() in Python。非經特殊聲明,原始代碼版權歸原作者所有,本譯文未經允許或授權,請勿轉載或複製。