Matplotlib是Python中的一個庫,它是數字的-NumPy庫的數學擴展。軸類包含大多數圖形元素:Axis,Tick,Line2D,Text,Polygon等,並設置坐標係。 Axes實例通過callbacks屬性支持回調。
matplotlib.axes.Axes.get_rasterized()函數
matplotlib庫的axiss模塊中的Axes.get_rasterized()函數用於獲取是否要對藝術家進行柵格化。
用法: Axes.get_rasterized(self)
參數:此方法不接受任何參數。
返回:此方法返回藝術家是否要柵格化。
以下示例說明了matplotlib.axes中的matplotlib.axes.Axes.get_rasterized()函數:
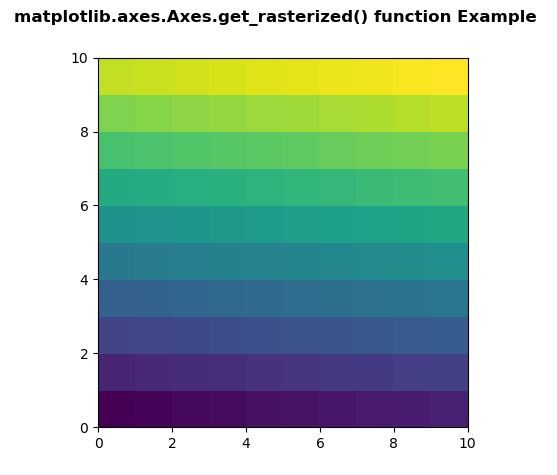
範例1:
# Implementation of matplotlib function
import numpy as np
import matplotlib.pyplot as plt

d = np.arange(100).reshape(10, 10)
xx, yy = np.meshgrid(np.arange(11), np.arange(11))

fig, ax = plt.subplots()

ax.set_aspect(1)
m = ax.pcolormesh(xx, yy, d)
if m.get_rasterized()== None:
    m.set_rasterized(True)

fig.suptitle('matplotlib.axes.Axes.get_rasterized() \
function Example', fontweight ="bold")

plt.show()
輸出:
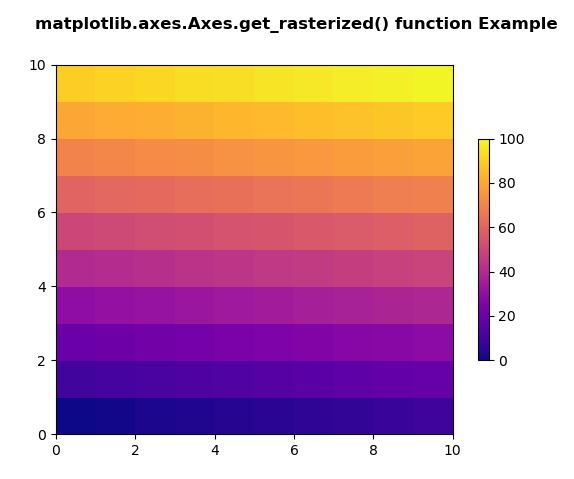
範例2:
# Implementation of matplotlib function
import matplotlib.pyplot as plt
import matplotlib.colors as mcolors
import matplotlib.gridspec as gridspec
import numpy as np


arr = np.arange(100).reshape((10, 10))
norm = mcolors.Normalize(vmin = 0., vmax = 100.)

pc_kwargs = {'cmap':'plasma', 'norm':norm}

fig, ax = plt.subplots( )

im = ax.pcolormesh(arr, **pc_kwargs)
fig.colorbar(im, ax = ax, shrink = 0.6)

if ax.get_rasterized()== None:
    ax.set_rasterized(False)

fig.suptitle('matplotlib.axes.Axes.get_rasterized()\
 function Example', fontweight ="bold")

plt.show()
輸出:
注:本文由純淨天空篩選整理自SHUBHAMSINGH10大神的英文原創作品 Matplotlib.axes.Axes.get_rasterized() in Python。非經特殊聲明,原始代碼版權歸原作者所有,本譯文未經允許或授權,請勿轉載或複製。