Matplotlib是Python中的一個庫,它是數字的-NumPy庫的數學擴展。軸類包含大多數圖形元素:Axis,Tick,Line2D,Text,Polygon等,並設置坐標係。 Axes實例通過callbacks屬性支持回調。
matplotlib.axes.Axes.clabel()函數
matplotlib庫的axiss模塊中的Axes.clabel()函數用於標記輪廓圖。
用法:
Axes.clabel(self, CS, *args, **kwargs)
參數:此方法接受以下描述的參數:
- cs:此參數是要標記的ContourSet。
- fontsize:此參數以磅為單位。
- gridsize:此參數表示x方向或兩個方向上的六邊形數量。
- colors:此參數用於給標簽著色
- inline:此參數刪除放置標簽的基礎輪廓。
- inline_spacing:此參數是以行為單位的像素內留在標簽兩邊的間距。
- marginals:此參數用於沿x軸底部和y軸左側繪製顏色映射為矩形的邊際密度。
- fmt:此參數是標簽的格式字符串。
- manual:此參數用於使用鼠標放置Contuor標簽。
- rightside_up:此參數用於旋轉標簽。
- use_clabeltext:此參數用於創建標簽。 ClabelText重新計算文本的旋轉角度。
返回值:這將返回以下內容:
- 標簽:這將返回標簽的Text實例列表。
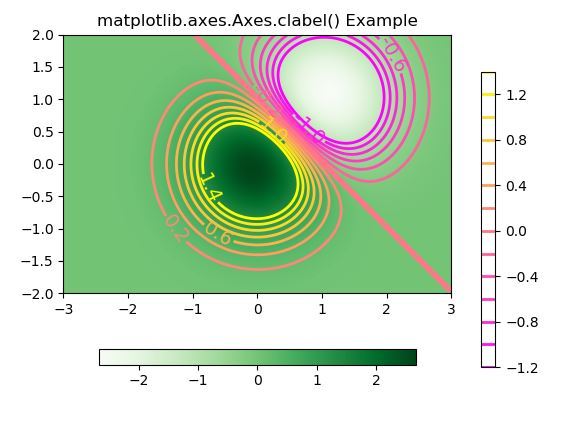
以下示例說明了matplotlib.axes中的matplotlib.axes.Axes.clabel()函數:
示例1:
# Implementation of matplotlib function
import numpy as np
import matplotlib.pyplot as plt
import matplotlib.ticker as ticker
import matplotlib

delta = 2.5
x = np.arange(-13.0, 13.0, delta)
y = np.arange(-12.0, 12.0, delta)
X, Y = np.meshgrid(x, y)
Z = (np.exp(-X**2 - Y**2) - np.exp(-(X - 1)**2 - (Y - 1)**2)) * 3

fig1, ax1 = plt.subplots()
CS1 = ax1.contour(X, Y, Z)

fmt = {}
strs = ['1', '2', '3', '4', '5', '6', '7']
for l, s in zip(CS1.levels, strs):
    fmt[l] = s
ax1.clabel(CS1, CS1.levels, inline = True,
           fmt = fmt, fontsize = 10)

ax1.set_title('matplotlib.axes.Axes.clabel() Example')
plt.show()
輸出:

示例2:
# Implementation of matplotlib function
import matplotlib
import numpy as np
import matplotlib.cm as cm
import matplotlib.pyplot as plt

delta = 0.025
x = np.arange(-3.0, 3.0, delta)
y = np.arange(-2.0, 2.0, delta)
X, Y = np.meshgrid(x, y)
Z = (np.exp(-X**2 - Y**2) - np.exp(-(X - 1)**2 - (Y - 1)**2)) * 3

fig, ax = plt.subplots()
im = ax.imshow(Z, interpolation ='bilinear', origin ='lower',
               cmap ="Greens", extent =(-3, 3, -2, 2))

levels = np.arange(-1.2, 1.6, 0.2)
CS = ax.contour(Z, levels, origin ='lower', cmap ='spring',
                linewidths = 2, extent =(-3, 3, -2, 2))
zc = CS.collections[6]
plt.setp(zc, linewidth = 4)

ax.clabel(CS, levels[1::2], inline = 1, fmt ='% 1.1f',
          fontsize = 14)

CB = fig.colorbar(CS, shrink = 0.8, extend ='both')
CBI = fig.colorbar(im, orientation ='horizontal',
                   shrink = 0.8)

ax.set_title('matplotlib.axes.Axes.clabel() Example')
plt.show()
輸出:

相關用法
注:本文由純淨天空篩選整理自SHUBHAMSINGH10大神的英文原創作品 Matplotlib.axes.Axes.clabel() in Python。非經特殊聲明,原始代碼版權歸原作者所有,本譯文未經允許或授權,請勿轉載或複製。
