Matplotlib是Python中的一個庫,它是數字的-NumPy庫的數學擴展。軸類包含大多數圖形元素:Axis,Tick,Line2D,Text,Polygon等,並設置坐標係。 Axes實例通過callbacks屬性支持回調。
matplotlib.axes.Axes.axvline()函數
matplotlib庫的axiss模塊中的Axes.axvline()函數用於在軸上添加一條垂直線。
用法: Axes.axvline(self, x=0, ymin=0, ymax=1, **kwargs)
參數:此方法接受以下描述的參數:
- x:此參數是垂直行數據坐標中的x位置,默認值為0。
- ymin:此參數應在0到1,之間,0是圖的底部,1是圖的頂部,其默認值為0。
- ymax:此參數應在0到1之間,0是圖的底部,1是圖的頂部。其默認值為1。
返回值:這將返回以下內容:
- lines:這將返回代表繪製數據的Line2D對象的列表。
以下示例說明了matplotlib.axes中的matplotlib.axes.Axes.axhline()函數:
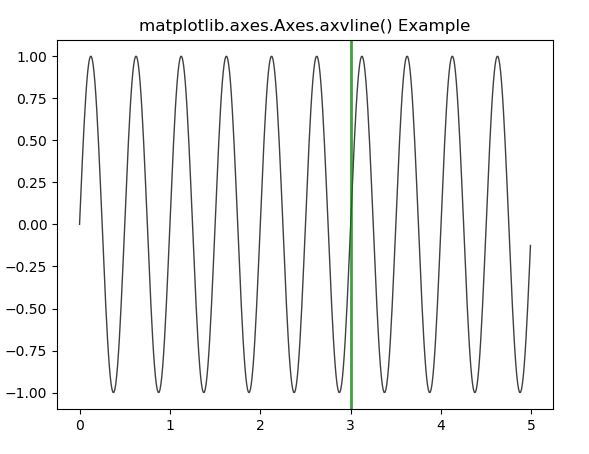
範例1:
# Implementation of matplotlib function
import matplotlib.pyplot as plt
import numpy as np
import matplotlib.collections as collections

t = np.arange(0.0, 5, 0.01)
s1 = np.sin(4 * np.pi * t)

fig, ax = plt.subplots()

ax.plot(t, s1, color ='black', alpha = 0.75, lw = 1)
ax.axvline(3, color ='green', lw = 2, alpha = 0.75)
ax.set_title('matplotlib.axes.Axes.axvline() Example')
plt.show()
輸出:
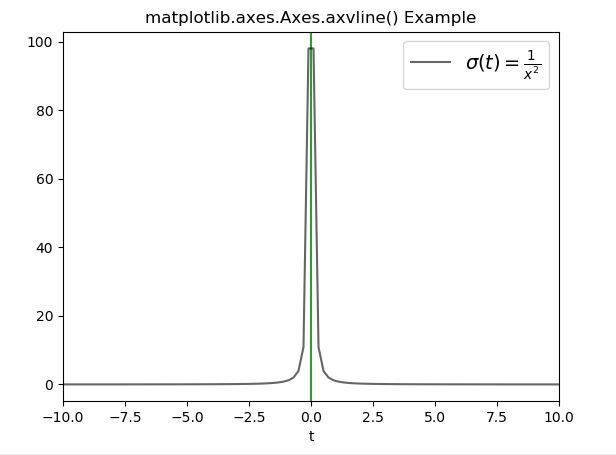
範例2:
# Implementation of matplotlib function
import matplotlib.pyplot as plt
import numpy as np

t = np.linspace(-10, 10, 100)
sig = 1 / t**2
fig, ax = plt.subplots()

plt.axvline(color ="green", alpha = 0.8, lw = 1.5)
plt.plot(t, sig, linewidth = 1.5, color ="black",
         alpha = 0.6,
         label = r"$\sigma(t) = \frac{1}{x ^ 2}$")

plt.xlim(-10, 10)
plt.xlabel("t")
plt.legend(fontsize = 14)

ax.set_title('matplotlib.axes.Axes.axvline() Example')
plt.show()
輸出:
相關用法
注:本文由純淨天空篩選整理自SHUBHAMSINGH10大神的英文原創作品 Matplotlib.axes.Axes.axvline() in Python。非經特殊聲明,原始代碼版權歸原作者所有,本譯文未經允許或授權,請勿轉載或複製。