Matplotlib是Python中的一個庫,它是數字的-NumPy庫的數學擴展。的Artist類包含呈現對象的Abstract基類到一個FigureCanvas中。圖中所有可見元素都是Artist的子類。
Matplotlib.artist.Artist.set_label()方法
matplotlib庫的藝術家模塊中的set_label()方法用於設置將在圖例中顯示的標簽。
用法:Artist.set_label(self, s)
參數:此方法僅接受一個參數。
- s:通過調用str,此參數將轉換為字符串。
返回值:此方法不返回任何值。
以下示例說明了matplotlib中的matplotlib.artist.Artist.set_label()函數:
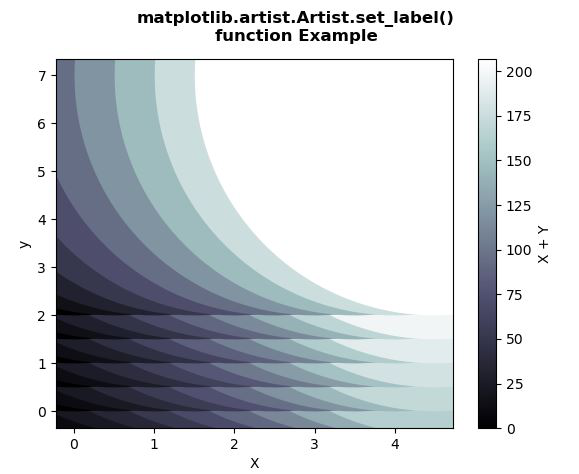
範例1:
# Implementation of matplotlib function
from matplotlib.artist import Artist
import matplotlib.pyplot as plt
import numpy as np
from matplotlib.collections import EllipseCollection


x = np.arange(10)
y = np.arange(15)
X, Y = np.meshgrid(x, y)

XY = np.column_stack((X.ravel(), Y.ravel()))

fig, ax = plt.subplots()

ec = EllipseCollection(10, 10, 5, units ='y',
                       offsets = XY * 0.5,
                       transOffset = ax.transData,
                       cmap ="bone")

ec.set_array((X * Y + X * X).ravel())

ax.add_collection(ec)
ax.autoscale_view()

ax.set_xlabel('X')
ax.set_ylabel('y')

cbar = plt.colorbar(ec)
cbar.set_label('X + Y')

fig.suptitle("""matplotlib.artist.Artist.set_label()
function Example""", fontweight="bold")

plt.show()
輸出:
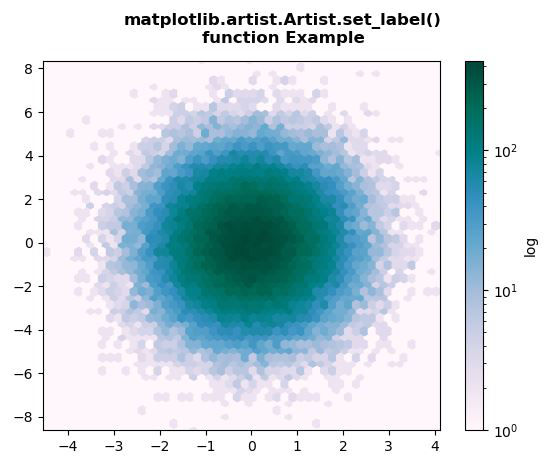
範例2:
# Implementation of matplotlib function
from matplotlib.artist import Artist
import matplotlib.pyplot as plt
import numpy as np


np.random.seed(19680801)

n = 100000
x = np.random.standard_normal(n)
y = 2 * np.random.standard_normal(n)
z =[1, 2, 3, 4]

xmin = x.min()
xmax = x.max()
ymin = y.min()
ymax = y.max()

fig, ax = plt.subplots()
hb = ax.hexbin(x, y,
               gridsize = 50,
               bins ='log',
               cmap ='PuBuGn')

ax.set(xlim =(xmin, xmax), ylim =(ymin, ymax))

cb = fig.colorbar(hb, ax = ax)
cb.set_label('log')

fig.suptitle("""matplotlib.artist.Artist.set_label()
function Example""", fontweight="bold")

plt.show()
輸出:
相關用法
注:本文由純淨天空篩選整理自shivanisinghss2110大神的英文原創作品 Matplotlib.artist.Artist.set_label() in Python。非經特殊聲明,原始代碼版權歸原作者所有,本譯文未經允許或授權,請勿轉載或複製。