直方圖是表示數據集中值分布的圖。為了繪製直方圖,數據集中的值範圍被分成均勻間隔的區間,並確定落入每個區間的數據值的數量。
用法
n=hist(y) // It bins the elements in vector y into ten equally spaced containers and returns the number of items in each container as a row vector.示例
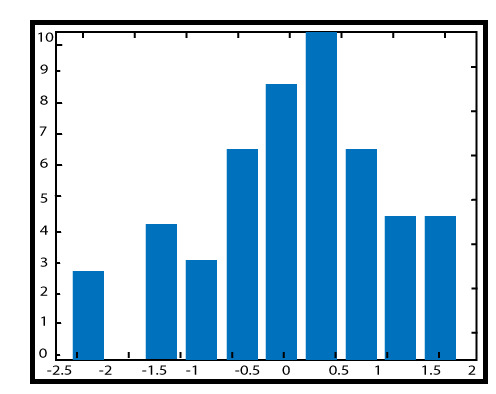
Histogram of 50 randomly distributed numbers between 0 and 1.
y=randn (50, 1);
hist (y)
輸出:
相關用法
- MATLAB meshz()用法及代碼示例
- MATLAB contour()用法及代碼示例
- MATLAB loglog()用法及代碼示例
- MATLAB ribbon()用法及代碼示例
- MATLAB comet()用法及代碼示例
- MATLAB Stairs()用法及代碼示例
- MATLAB pcolor()用法及代碼示例
- MATLAB Bar()用法及代碼示例
- MATLAB contour3()用法及代碼示例
- MATLAB barh()用法及代碼示例
- MATLAB area()用法及代碼示例
- MATLAB stem3()用法及代碼示例
- MATLAB waterfall()用法及代碼示例
- MATLAB quiver()用法及代碼示例
- MATLAB slice()用法及代碼示例
- MATLAB Semilogy()用法及代碼示例
- MATLAB plotyy()用法及代碼示例
- MATLAB fill3()用法及代碼示例
- MATLAB fill()用法及代碼示例
- MATLAB cylinder()用法及代碼示例
注:本文由純淨天空篩選整理自 MATLAB hist()。非經特殊聲明,原始代碼版權歸原作者所有,本譯文未經允許或授權,請勿轉載或複製。