沿曲線繪製誤差線
用法
errorbar(y,err)// It generates a line plot of the data in y and draw a vertical error bar at each data point. The values in err determines the lengths of each error bar above and below the data point, so the total error bar lengths are double the err values.
errorbar(x,y,err)// It plots y versus x and draws a vertical error bar at each data point.
errorbar(x,y,neg,pos)// It draws a vertical error bar at each data point, where neg determine the length below the data point, and pos determines the length above the data point, respectively.
errorbar(...,LineSpec)//  It sets the line style, marker symbol, and color.
h = errorbar(...)// It returns handles to the errorbarseries objects created. errorbar develops one object for vector input arguments and one object per column for matrix input arguments.
示例
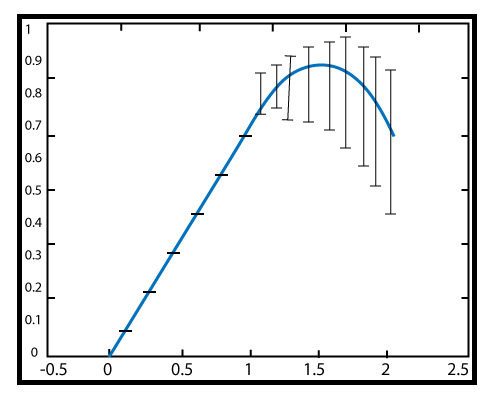
fapproax=x-x^3/3!,0â¤xâ¤2
error=f approax-sin?x
x=0:.1:2;
apprx2=x-x.^3/6;
er=apprx2-sin(x);
errorbar(x,apprx2,er)輸出:
相關用法
- MATLAB ellipsoid()用法及代碼示例
- MATLAB meshz()用法及代碼示例
- MATLAB contour()用法及代碼示例
- MATLAB loglog()用法及代碼示例
- MATLAB ribbon()用法及代碼示例
- MATLAB comet()用法及代碼示例
- MATLAB Stairs()用法及代碼示例
- MATLAB pcolor()用法及代碼示例
- MATLAB Bar()用法及代碼示例
- MATLAB contour3()用法及代碼示例
- MATLAB barh()用法及代碼示例
- MATLAB area()用法及代碼示例
- MATLAB stem3()用法及代碼示例
- MATLAB waterfall()用法及代碼示例
- MATLAB quiver()用法及代碼示例
- MATLAB slice()用法及代碼示例
- MATLAB Semilogy()用法及代碼示例
- MATLAB plotyy()用法及代碼示例
- MATLAB fill3()用法及代碼示例
- MATLAB fill()用法及代碼示例
注:本文由純淨天空篩選整理自 MATLAB errorbar()。非經特殊聲明,原始代碼版權歸原作者所有,本譯文未經允許或授權,請勿轉載或複製。