D3.js中的d3.svg.axis()函數用於創建新的默認軸。該函數將在該軸上構造一個新軸,可以執行各種操作。
用法:
d3.svg.axis()
參數:此函數不接受任何參數。
返回值:該函數返回創建的軸。
以下程序說明了D3.js中的d3.svg.axis()函數:
範例1:
HTML
<html>
<head>
<title>
D3.js | d3.axisLeft() Function
</title>
<script src="//d3js.org/d3.v3.min.js"></script>
</head>
<body>
<script>
var svg = d3.select("body").append("svg")
.attr("width", 400)
.attr("height", 400);
// Create the Scale we will use
// for the Axis
var axisScale = d3.scale.linear()
.domain([0, 100])
.range([0, 300]);
// Create the Axis
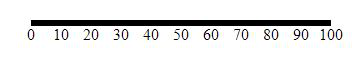
var xAxis = d3.svg.axis()
.scale(axisScale);
// Create an SVG group Element for
// the Axis elements and call the
// xAxis function
svg.append("g")
.attr("transform", "translate(50, 50)")
.call(xAxis);
</script>
</body>
</html>輸出:
範例2:
HTML
<html>
<head>
<title>
D3.js | d3.axisLeft() Function
</title>
<script src="//d3js.org/d3.v3.min.js"></script>
</head>
<body>
<script>
var svg = d3.select("body").append("svg")
.attr("width", 400)
.attr("height", 400);
// Create the Scale we will use for the Axis
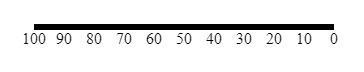
var axisScale = d3.scale.linear()
.domain([0, 100])
.range([300, 0]);
// Create the Axis
var xAxis = d3.svg.axis()
.scale(axisScale);
// Create an SVG group Element for the
// Axis elements and call the xAxis function
svg.append("g")
.attr("transform", "translate(50, 50)")
.call(xAxis);
</script>
</body>
</html>輸出:
相關用法
- PHP Ds\Set contains()用法及代碼示例
- PHP Ds\Set xor()用法及代碼示例
- PHP abs()用法及代碼示例
- d3.js d3.lab()用法及代碼示例
- PHP Ds\Set first()用法及代碼示例
- PHP Ds\Map put()用法及代碼示例
- PHP Ds\Map xor()用法及代碼示例
- p5.js mag()用法及代碼示例
- PHP ord()用法及代碼示例
- d3.js d3.hcl()用法及代碼示例
- PHP sin( )用法及代碼示例
- PHP cos( )用法及代碼示例
- p5.js value()用法及代碼示例
- PHP each()用法及代碼示例
- p5.js nf()用法及代碼示例
注:本文由純淨天空篩選整理自SHUBHAMSINGH10大神的英文原創作品 D3.js svg.axis() Function。非經特殊聲明,原始代碼版權歸原作者所有,本譯文未經允許或授權,請勿轉載或複製。