JavaScript庫D3.js使用HTML5,可縮放矢量圖形和級聯樣式表為網頁提供動態的交互式數據可視化。 d3.js庫中的geoHyperelliptical()函數用於繪製偽圓柱equal-area Goode同型牛磺酸投影。
用法:
d3.geoHyperelliptical( k, alpha ,gamma)
參數:該方法接受上述和以下所述的三個參數。
- k:定義子午線形狀的超橢圓(或Lamé曲線)的 index 。默認值為2.5。
- alpha:它控製圓柱投影的重量,該重量與超橢圓平均。默認值為0。
- gamma:長寬比。默認值為1.183136。
返回值:此方法根據給定的JSON數據創建超橢圓投影。
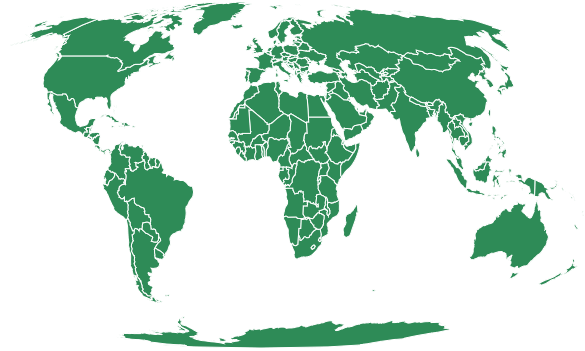
範例1:下麵的示例繪製以(0,0)為中心且旋轉為0的世界的超橢圓投影。
HTML
<!DOCTYPE html>
<html lang="en">

<head>
    <meta charset="UTF-8" />
    <meta name="viewport" content=
        "width=device-width, initial-scale=1.0" />
    <script src="https://d3js.org/d3.v4.js"></script>
    <script src=
    "https://d3js.org/d3-geo-projection.v2.min.js">
    </script>
</head>

<body>
    <div style="width:700px; height:600px;">
        <svg width="700" height="400">
        </svg>
    </div>

    <script>
        var svg = d3.select("svg"),
            width = +svg.attr("width"),
            height = +svg.attr("height");

        // Hyperelliptical projection
        // Center(0,0) and no rotation
        var gfg = d3.geoHyperelliptical()
            .scale(width / 2.0 / Math.PI)
            .rotate([0, 0])
            .center([0, 0])
            .translate([width / 2, height / 2])

        // Loading the json data
        // Used json file stored at
        // https://raw.githubusercontent.com/janasayantan
        // datageojson/master/world.json
        d3.json("https://raw.githubusercontent.com/
            + "janasayantan/datageojson/master/world.json",
            function (data) {

                // Draw the map
                svg.append("g")
                    .selectAll("path")
                    .data(data.features)
                    .enter().append("path")
                    .attr("fill", "seagreen")
                    .attr("d", d3.geoPath()
                        .projection(gfg)
                    )
                    .style("stroke", "#ffff")
            })
    </script>
</body>

</html>
輸出:
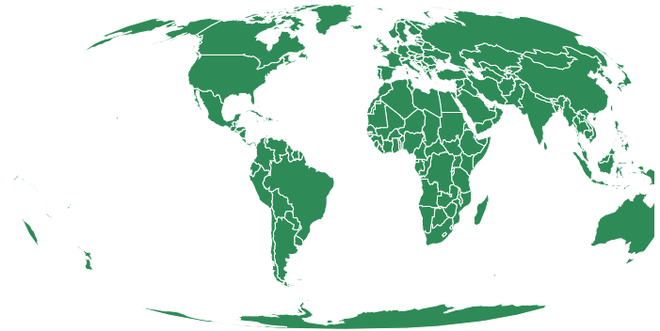
範例2:下麵的示例在更改中心和旋轉後繪製世界的超橢圓投影。
HTML
<!DOCTYPE html>
<html lang="en">

<head>
    <meta charset="UTF-8" />
    <meta name="viewport" content=
    "width=device-width, initial-scale=1.0" />
    <script src="https://d3js.org/d3.v4.js"></script>
    <script src=
    "https://d3js.org/d3-geo-projection.v2.min.js">
    </script>
</head>

<body>
    <div style="width:700px; height:600px;">
        <svg width="700" height="400"></svg>
    </div>

    <script>

        var svg = d3.select("svg"),
            width = +svg.attr("width"),
            height = +svg.attr("height");

        // Hyperelliptical projection
        // Center(-10,-10) and 30 degree
        // rotation with respect to Y axis
        var gfg = d3.geoHyperelliptical(
            k = 3.0, alpha = 2, gamma = 2)
            .scale(width / 2.0 / Math.PI)
            .rotate([30, 0])
            .center([-10, -10])
            .translate([width / 2, height / 2])

        // Loading the json data
        // Used json file stored at
        // https://raw.githubusercontent.com
        // /janasayantan/datageojson/master/world.json

        d3.json("https://raw.githubusercontent.com/"
            + "janasayantan/datageojson/master/world.json",
            function (data) {

                // Draw the map
                svg.append("g")
                    .selectAll("path")
                    .data(data.features)
                    .enter().append("path")
                    .attr("fill", "seagreen")
                    .attr("d", d3.geoPath()
                        .projection(gfg)
                    )
                    .style("stroke", "#ffff")
            })
    </script>
</body>

</html>
輸出:
相關用法
- PHP imagecreatetruecolor()用法及代碼示例
- p5.js year()用法及代碼示例
- d3.js d3.utcTuesdays()用法及代碼示例
- PHP ImagickDraw getTextAlignment()用法及代碼示例
- PHP Ds\Sequence last()用法及代碼示例
- PHP array_udiff_uassoc()用法及代碼示例
- PHP geoip_continent_code_by_name()用法及代碼示例
- d3.js d3.map.set()用法及代碼示例
- PHP GmagickPixel setcolor()用法及代碼示例
- PHP opendir()用法及代碼示例
- PHP cal_to_jd()用法及代碼示例
- d3.js d3.bisectLeft()用法及代碼示例
- PHP stream_get_transports()用法及代碼示例
- PHP Ds\Deque pop()用法及代碼示例
注:本文由純淨天空篩選整理自jana_sayantan大神的英文原創作品 D3.js geoHyperelliptical() Function。非經特殊聲明,原始代碼版權歸原作者所有,本譯文未經允許或授權,請勿轉載或複製。