d3.js中的geoAlbers()函數用於繪製Albers equal-area圓錐投影。以Heinrich C命名的Albers投影。Albers是使用兩個標準平行線的圓錐形equal-areaMap投影。在標準平行線之間,不保留比例和形狀,並且變形最小。它從geojson數據繪製了一個geoAlbers投影。
用法:
d3.geoAlbers()
參數:此方法不接受任何參數。
返回值此方法返回可視的Albers equal-area圓錐投影。
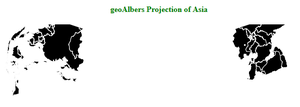
範例1:以下示例對亞洲大陸進行了預測。
HTML
<!DOCTYPE html>
<html lang="en">

<head>
    <meta charset="UTF-8" />
    <meta name="viewport"
        content="width=device-width,
                initial-scale=1.0"/>
</head>

<body>
    <div style="width:700px; height:700px;">
        <center>

            <h4 style="color:green" font ='bold'>
            geoAlbers Projection of Asia
            </h4>
        </center>

        <svg width="700" height="500">
        </svg>
    </div>
    <script src="https://d3js.org/d3.v4.js">
    </script>
    <script src="
    https://d3js.org/d3-geo-projection.v2.min.js">
   </script>
    <script>

    var svg = d3.select("svg"),
    width = +svg.attr("width"),
    height = +svg.attr("height");

   // geoAlbers projection
   var gfg = d3.geoAlbers()
    .scale(width / 1.5 / Math.PI)
    .translate([width / 2, height / 2])

   // Loading the json data
   d3.json("https://raw.githubusercontent.com/
   janasayantan/datageojson/master/geoasia.json",
    function(data){

    // Draw the map
    svg.append("g")
         .selectAll("path")
         .data(data.features)
         .enter().append("path")
         .attr("fill", "black")
         .attr("d", d3.geoPath()
          .projection(gfg)
          )
      .style("stroke", "#ffff")
})

</script>
</body>

</html>
輸出:
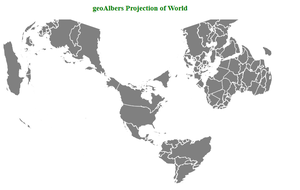
範例2:以下示例顯示了World的投影。
HTML
<!DOCTYPE html>
<html lang="en">

<head>
    <meta charset="UTF-8" />
    <meta name="viewport"
        content="width=device-width,
                initial-scale=1.0"/>
</head>

<body>
    <div style="width:700px; height:700px;">
        <center>

            <h3 style="color:green" font ='bold'>
            geoAlbers Projection of World
            </h3>

        </center>
        <svg width="700" height="500">
        </svg>
    </div>
    <script src="https://d3js.org/d3.v4.js">
    </script>
    <script src="https://d3js.org/
    d3-geo-projection.v2.min.js">
    </script>
    <script>

    var svg = d3.select("svg"),
    width = +svg.attr("width"),
    height = +svg.attr("height");

    // geoAlbers projection
    var gfg = d3.geoAlbers()
    .scale(width / 1.5 / Math.PI)
    .translate([width / 2, height / 2])

    // Loading the json data
    d3.json("https://raw.githubusercontent.com/
    janasayantan/datageojson/master/geoworld%20.json",
    function(data)
   {
    // Draw the map
    svg.append("g")
        .selectAll("path")
        .data(data.features)
        .enter().append("path")
            .attr("fill", "grey")
            .attr("d", d3.geoPath()
            .projection(gfg)
            )
        .style("stroke", "#ffff")
   })

</script>
</body>
</html>
輸出:
相關用法
- PHP imagecreatetruecolor()用法及代碼示例
- p5.js year()用法及代碼示例
- d3.js d3.utcTuesdays()用法及代碼示例
- PHP ImagickDraw getTextAlignment()用法及代碼示例
- PHP Ds\Sequence last()用法及代碼示例
- PHP array_udiff_uassoc()用法及代碼示例
- PHP geoip_continent_code_by_name()用法及代碼示例
- d3.js d3.map.set()用法及代碼示例
- PHP GmagickPixel setcolor()用法及代碼示例
- PHP opendir()用法及代碼示例
- PHP cal_to_jd()用法及代碼示例
- d3.js d3.bisectLeft()用法及代碼示例
- PHP stream_get_transports()用法及代碼示例
- PHP Ds\Deque pop()用法及代碼示例
注:本文由純淨天空篩選整理自jana_sayantan大神的英文原創作品 D3.js geoAlbers() Function。非經特殊聲明,原始代碼版權歸原作者所有,本譯文未經允許或授權,請勿轉載或複製。