D3.js中的d3.axis.orient()函數用於設置方向並返回軸。如果未指定方向,則返回當前方向,默認為“bottom”。
用法:
axis.orient([orientation])
參數:該函數接受如上所述和以下描述的單個參數:
- orientation:該參數的大小用於設置軸的方向。支持四個方向:“top”,“bottom”。 “left”和“right”。
返回值:該函數返回軸。
以下程序說明了D3.js中的d3.axis.orient()函數:
範例1:
HTML
<html>
<head>
<title>
D3.js | d3.axis.orient() Function
</title>
<script src = "//d3js.org/d3.v3.min.js"></script>
</head>
<body>
<script>
var svg = d3.select("body").append("svg")
.attr("width", 400)
.attr("height", 400);
// Create the Scale we will use for the Axis
var axisScale = d3.scale.linear()
.domain([0, 100])
.range([0, 300]);
// Create the Axis
var xAxis = d3.svg.axis()
.scale(axisScale)
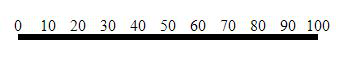
.orient("top");
// Create an SVG group Element for the Axis
// elements and call the xAxis function
svg.append("g")
.attr("transform", "translate(50,50)")
.call(xAxis);
</script>
</body>
</html>輸出:
範例2:
HTML
<html>
<head>
<title>
D3.js | d3.axis.orient() Function
</title>
<script src = "//d3js.org/d3.v3.min.js"></script>
</head>
<body>
<script>
var svg = d3.select("body").append("svg")
.attr("width", 400)
.attr("height", 400);
// Create the Scale we will use for the Axis
var axisScale = d3.scale.linear()
.domain([0, 100])
.range([0, 300]);
// Create the Axis
var xAxis = d3.svg.axis()
.scale(axisScale)
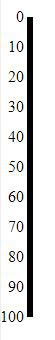
.orient("left");
// Create an SVG group Element for the Axis
// elements and call the xAxis function
svg.append("g")
.attr("transform", "translate(50,50)")
.call(xAxis);
</script>
</body>
</html>輸出:
範例3:
HTML
<html>
<head>
<title>
D3.js | d3.axis.orient() Function
</title>
<script src = "//d3js.org/d3.v3.min.js"></script>
</head>
<body>
<script>
var svg = d3.select("body").append("svg")
.attr("width", 400)
.attr("height", 400);
// Create the Scale we will use for the Axis
var axisScale = d3.scale.linear()
.domain([0, 100])
.range([0, 300]);
// Create the Axis
var xAxis = d3.svg.axis()
.scale(axisScale)
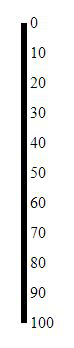
.orient("right");
// Create an SVG group Element for the Axis
// elements and call the xAxis function
svg.append("g")
.attr("transform", "translate(50,50)")
.call(xAxis);
</script>
</body>
</html>輸出:
相關用法
- PHP imagecreatetruecolor()用法及代碼示例
- p5.js year()用法及代碼示例
- d3.js d3.utcTuesdays()用法及代碼示例
- PHP ImagickDraw getTextAlignment()用法及代碼示例
- PHP Ds\Sequence last()用法及代碼示例
- PHP array_udiff_uassoc()用法及代碼示例
- PHP geoip_continent_code_by_name()用法及代碼示例
- d3.js d3.map.set()用法及代碼示例
- PHP GmagickPixel setcolor()用法及代碼示例
- PHP opendir()用法及代碼示例
- PHP cal_to_jd()用法及代碼示例
- d3.js d3.bisectLeft()用法及代碼示例
- PHP stream_get_transports()用法及代碼示例
- PHP Ds\Deque pop()用法及代碼示例
注:本文由純淨天空篩選整理自SHUBHAMSINGH10大神的英文原創作品 D3.js axis.orient() Function。非經特殊聲明,原始代碼版權歸原作者所有,本譯文未經允許或授權,請勿轉載或複製。