Bokeh是Python中的數據可視化庫,提供high-performance交互式圖表和繪圖,並且可以通過筆記本,HTML和服務器等各種介質獲得輸出。 Figure類創建用於繪製的新Figure。它是Plot的子類,可通過默認軸,網格,工具等簡化繪圖創建。
bokeh.plotting.figure.cross()函數
散景庫的繪圖模塊中的cross()函數用於配置Cross字形並將其添加到該圖形中。
用法: cross(x, y, size=4, angle=0.0, *, angle_units=’rad’, fill_alpha=1.0, fill_color=’gray’, line_alpha=1.0, line_cap=’butt’, line_color=’black’, line_dash=[], line_dash_offset=0, line_join=’bevel’, line_width=1, name=None, tags=[], **kwargs)
參數:此方法接受下麵描述的以下參數:
- x:此參數是標記中心的x-coordinates。
- y:此參數是標記中心的y-coordinates。
- size:此參數是屏幕空間單位中標記的大小(直徑)值。
- angle:此參數是旋轉標記的角度。
- fill_color:此參數是標記的填充顏色值。
- line_color:此參數是標記的線條顏色值,默認值為黑色。
- line_dash:此參數是標記的線破折號,默認值為[]。
- name:此參數是此模型的用戶提供的名稱。
- tags:此參數是該模型的用戶提供的值。
返回:此方法返回GlyphRenderer值。
以下示例說明了bokeh.plotting中的bokeh.plotting.figure.circle_y()函數:
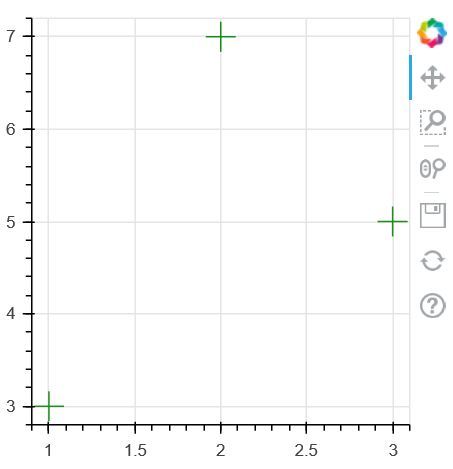
範例1:
Python3
# Implementation of bokeh function

import numpy as np
from bokeh.plotting import figure, output_file, show

plot = figure(plot_width=300, plot_height=300)
plot.cross(x=[1, 2, 3], y=[3, 7, 5],
           size=20, color="green", alpha=0.9)

show(plot)
輸出:

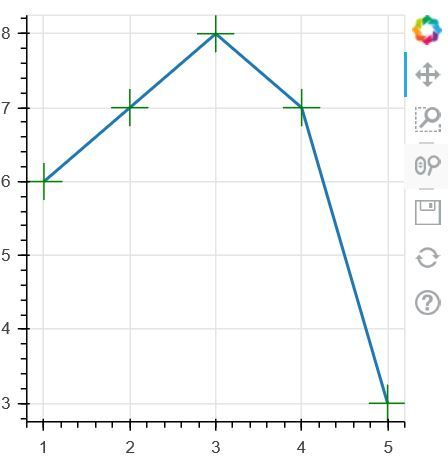
範例2:
Python3
# Implementation of bokeh function

import numpy as np
from bokeh.plotting import figure, output_file, show

x = [1, 2, 3, 4, 5]
y = [6, 7, 8, 7, 3]

output_file("geeksforgeeks.html")

p = figure(plot_width=300, plot_height=300)

# add both a line and circles on the
# same plot
p.line(x, y, line_width=2)
p.cross(x, y, fill_color="red",
        line_color="green", size=25)

show(p)
輸出:

相關用法
- Python Wand function()用法及代碼示例
- Python Sorted()用法及代碼示例
- Python Numbers choice()用法及代碼示例
- Python Tkinter askopenfile()用法及代碼示例
- Python ord()用法及代碼示例
- Python sum()用法及代碼示例
- Python round()用法及代碼示例
- Python id()用法及代碼示例
- Python vars()用法及代碼示例
注:本文由純淨天空篩選整理自shubhamsingh84100大神的英文原創作品 bokeh.plotting.figure.cross() function in Python。非經特殊聲明,原始代碼版權歸原作者所有,本譯文未經允許或授權,請勿轉載或複製。
