abline()R語言中的函數用於向圖形添加一條或多條直線。這abline()函數可用於向繪圖添加垂直、水平或回歸線。
用法:
abline(a=NULL, b=NULL, h=NULL, v=NULL, …)
參數:
a, b:它指定線的截距和斜率
h:為水平線指定 y-value
v:為垂直線指定 x-value(s)
返回:圖中的一條直線
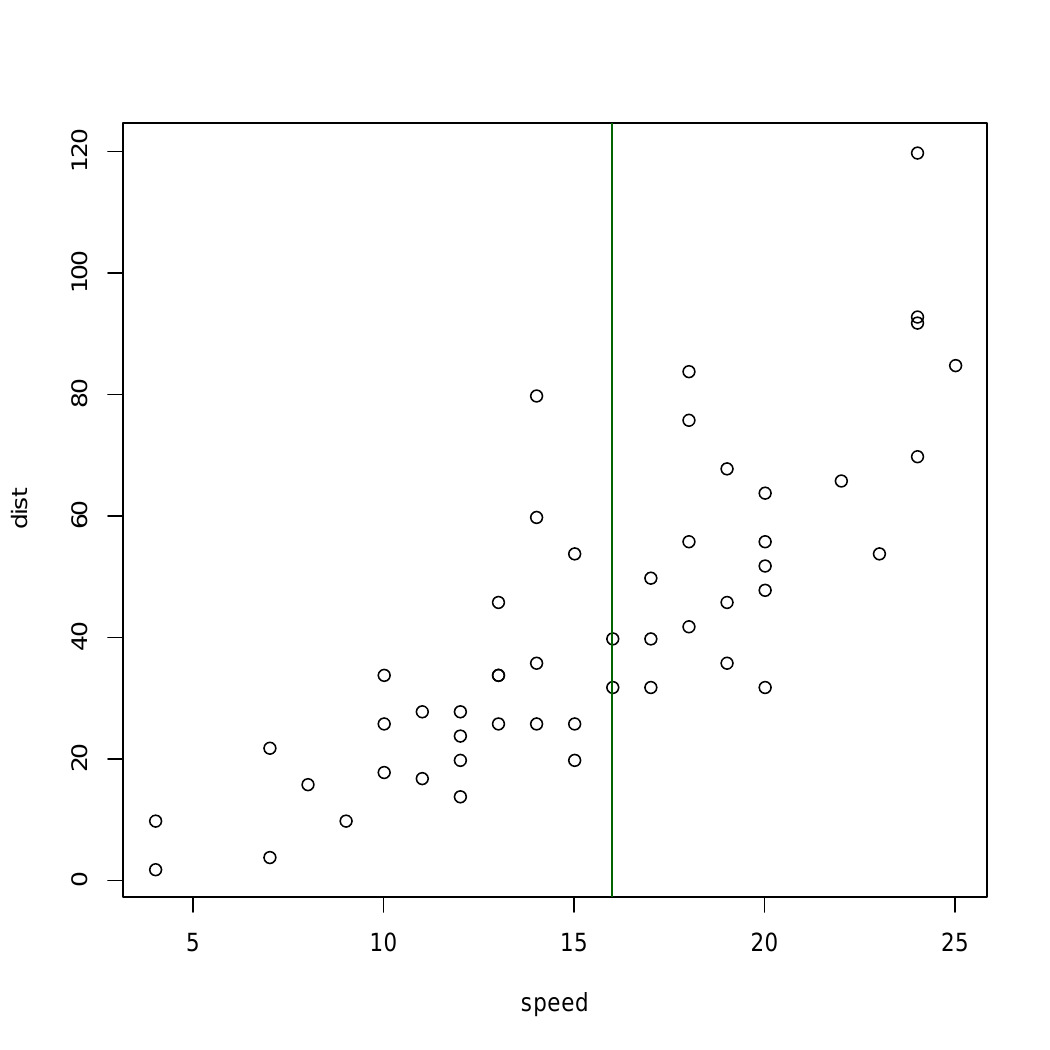
範例1:在圖中添加一條垂直線
# add line to square plot
# first example:Add one line
plot(cars)
abline(v = 16, col = "darkgreen")

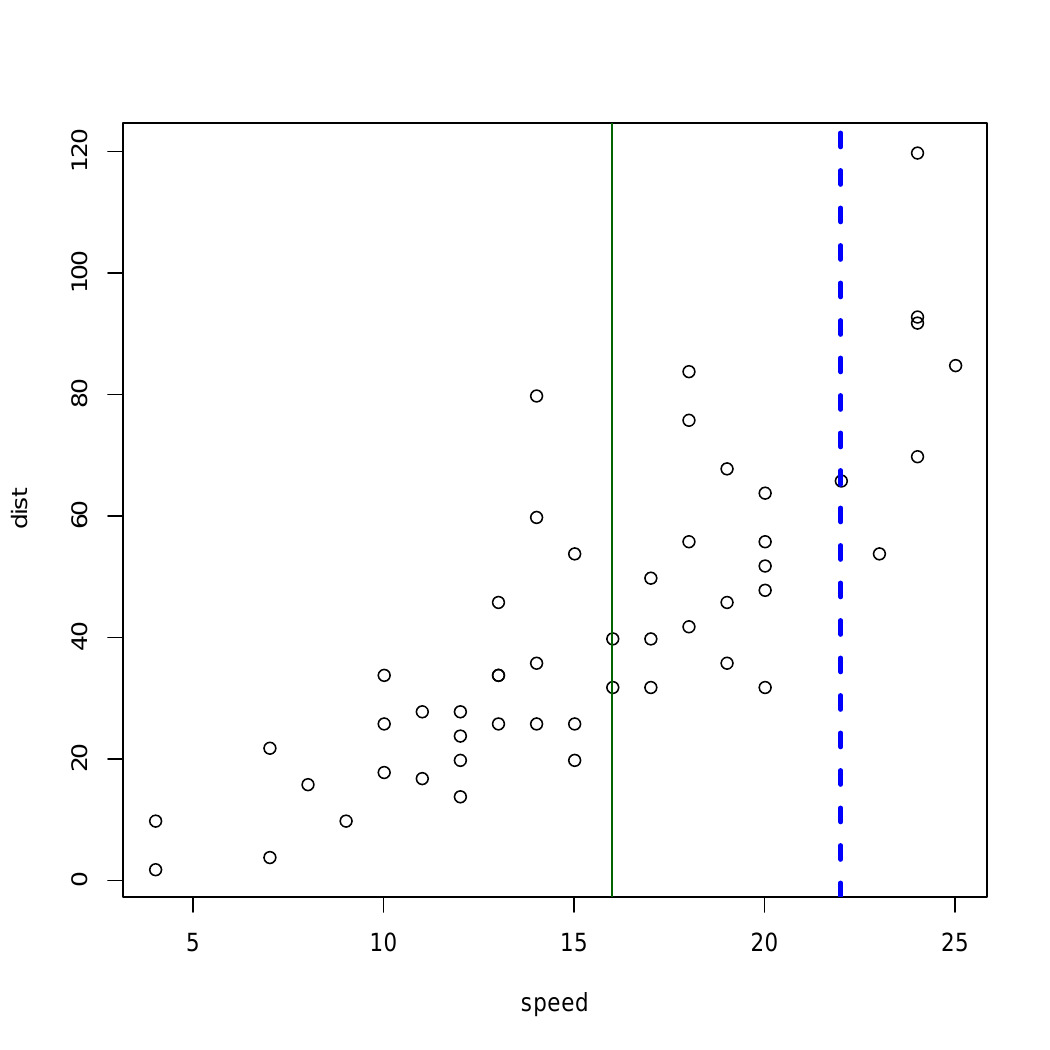
# second example:add 2 lines
# addline to square plot
# change line colors, sizes and types
plot(cars)
abline(v = c(16, 22), col = c("darkgreen", "blue"),
                      lty = c(1, 2), lwd = c(1, 3))

# third example
set.seed(1200); mydata<-rnorm(180)
hist(mydata, col="darkgreen")

# lwd=line width, lty =linetype
abline(v = mean(mydata), col = "blue", lwd = 4, lty = 4)
輸出:


在這裏,在上麵的示例中,使用 abline() 將直線添加到不同的圖形圖
範例2:添加水平線
# R program to add a horizontal line
# to a plot

# Creating a plot
plot(cars)

# Calling abline() function
abline(h = 60, col = "darkgreen")
輸出:

在上麵的例子中abline()函數在當前圖的指定 ‘x’ 坐標處繪製一條水平線。
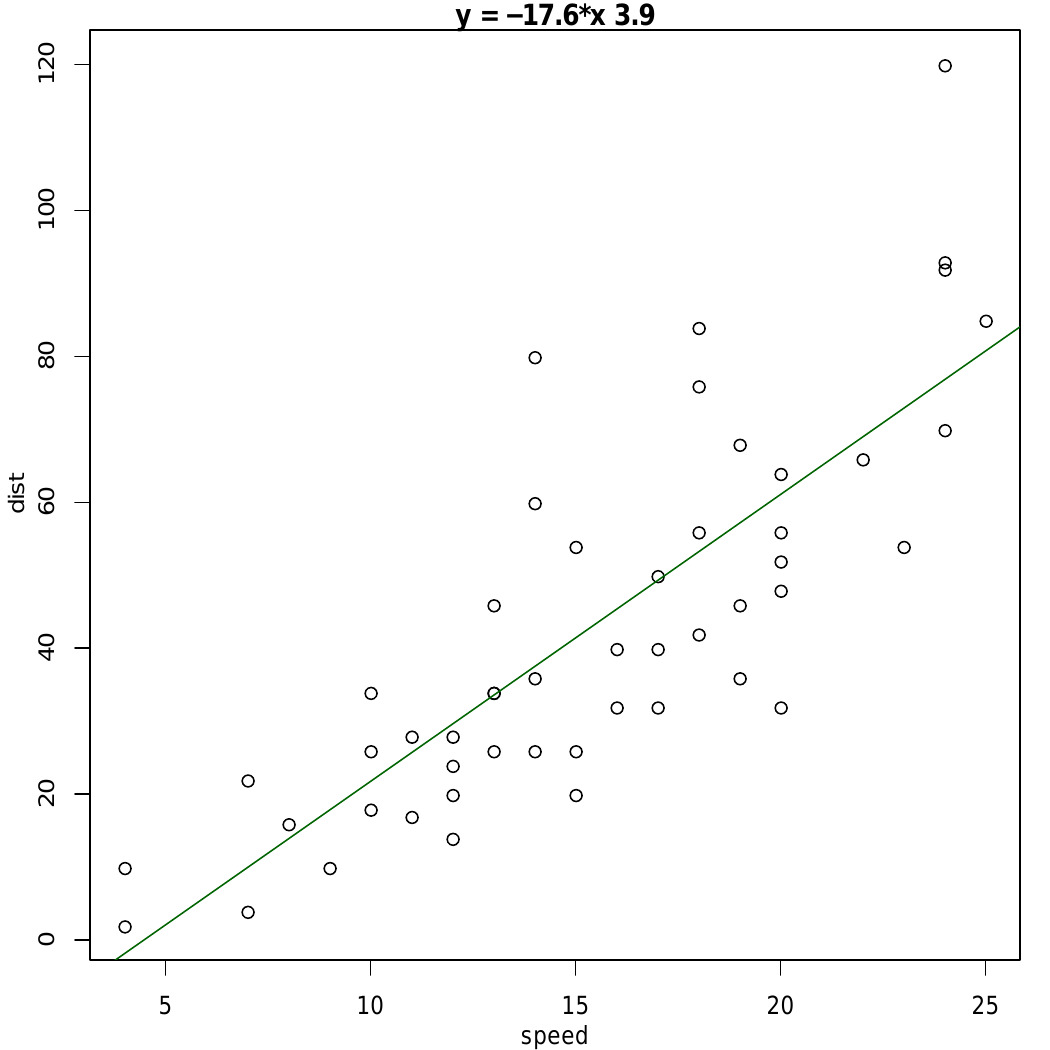
範例3:添加回歸線
par(mgp = c(2, 1, 0), mar = c(3, 3, 1, 1))

# Fit regression line
require(stats)
reg<-lm(dist ~ speed, data = cars)
coeff = coefficients(reg)

# equation of the line:
eq = paste0("y = ", round(coeff[1], 1), "*x ",
                    round(coeff[2], 1))

# plot
plot(cars, main = eq)
abline(reg, col = "darkgreen")
輸出:

在上麵的例子中,straight-line 使用線方程和abline()速度和距離之間的函數和繪圖關係。
相關用法
- R語言 lines()用法及代碼示例
- R語言 axis()用法及代碼示例
- R語言 readLines()用法及代碼示例
- R語言 points()用法及代碼示例
- R語言 arrows()用法及代碼示例
- R語言 dgeom()用法及代碼示例
- R語言 pairs()用法及代碼示例
- R語言 plot()用法及代碼示例
- R語言 jitter()用法及代碼示例
- R語言 append()用法及代碼示例
注:本文由純淨天空篩選整理自kaurbal1698大神的英文原創作品 Adding Straight Lines to a Plot in R Programming – abline() Function。非經特殊聲明,原始代碼版權歸原作者所有,本譯文未經允許或授權,請勿轉載或複製。
