R 語言中的 axis() 函數是將軸添加到繪圖中。它需要繪製軸作為參數的圖的一側。
用法:
axis(side, at=NULL, labels=TRUE)
參數:
side:它定義了在可能的值(例如下、左、上和右)上繪製軸的圖的一側。
at:點繪製刻度線
labels:指定 tick-mark 標簽的文本。
範例1:
# R program to draw axis in a plot
x <- 1:5; y = x * x
plot(x, y, axes = FALSE)

# Calling the axis() function
axis(side = 1, at = 1:5, labels = LETTERS[1:5])
axis(3)
輸出:
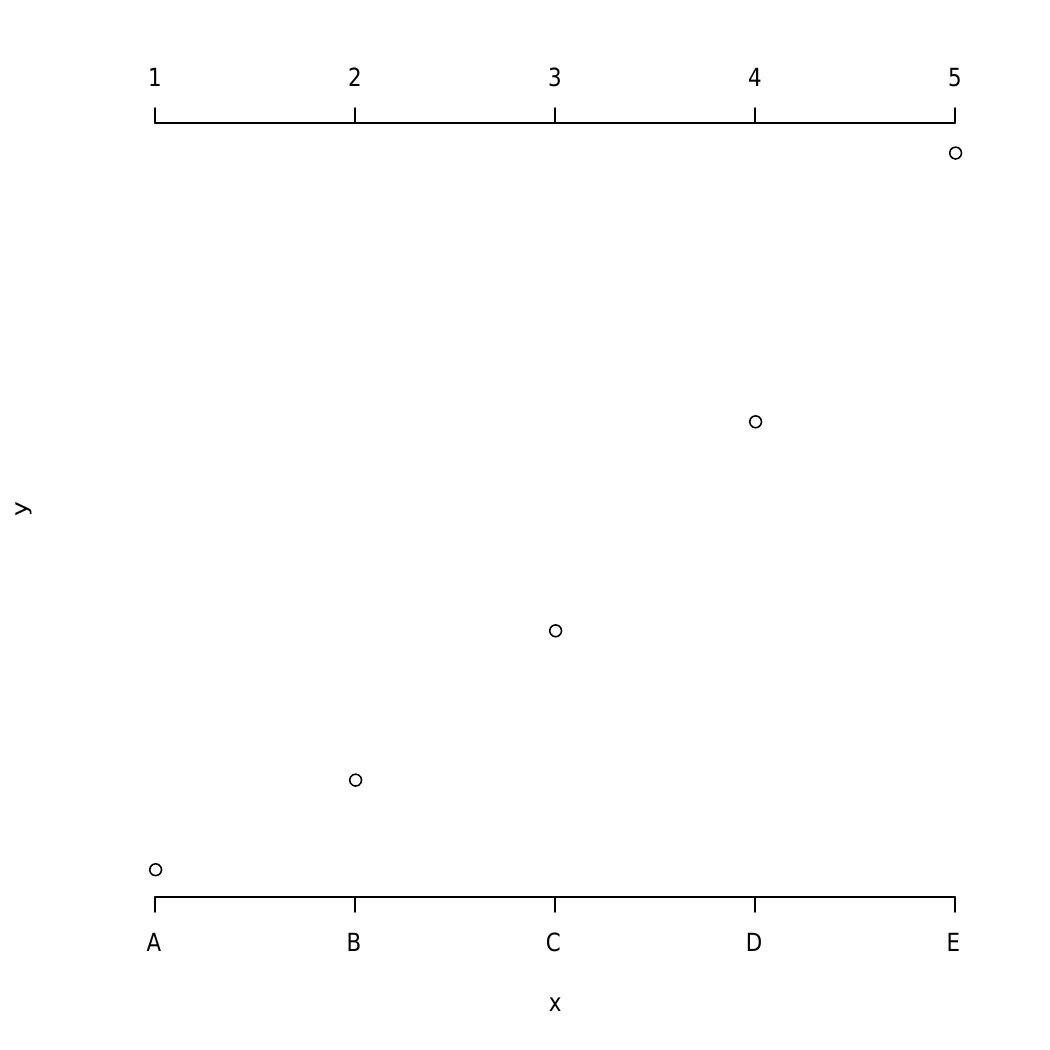
在上麵的示例中,將直線虛線添加到連接數字和字母值的繪圖中,繪圖軸繪製在繪圖的頂部和底部。
範例2:通過繪製框添加軸的另一個示例
# R program to draw axis to a plot
x<-1:5; y = x * x
plot(x, y, axes = FALSE)
axis(side=1, at = 1:5, labels = LETTERS[1:5])
axis(3)

#- To make it look like "usual" plot
box()
輸出:

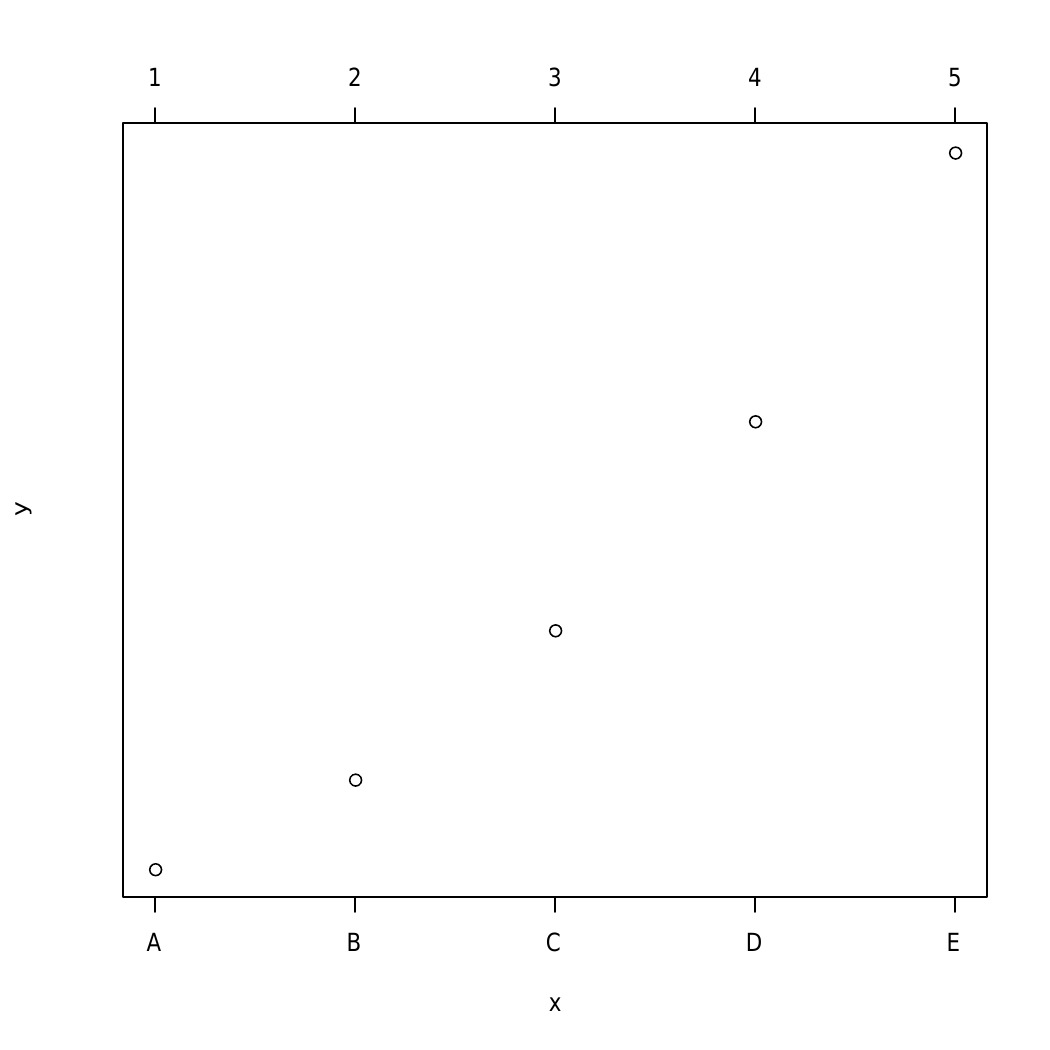
在這裏,使用 box() 函數圍繞軸繪製一個框,使其看起來像一個普通的圖。
範例3:
# R program to draw axis to a plot
x<-1:4; y=x*x
plot(x, y, pch = 18, col = "darkgreen", type = "b",
           frame = FALSE, xaxt = "n")

# Remove x axis
axis(1, 1:4, LETTERS[1:4], col.axis="blue")
axis(3, col = "darkgreen", lty = 2, lwd = 4)
axis(4, col = "black", col.axis = "blue", lwd = 4)
輸出:

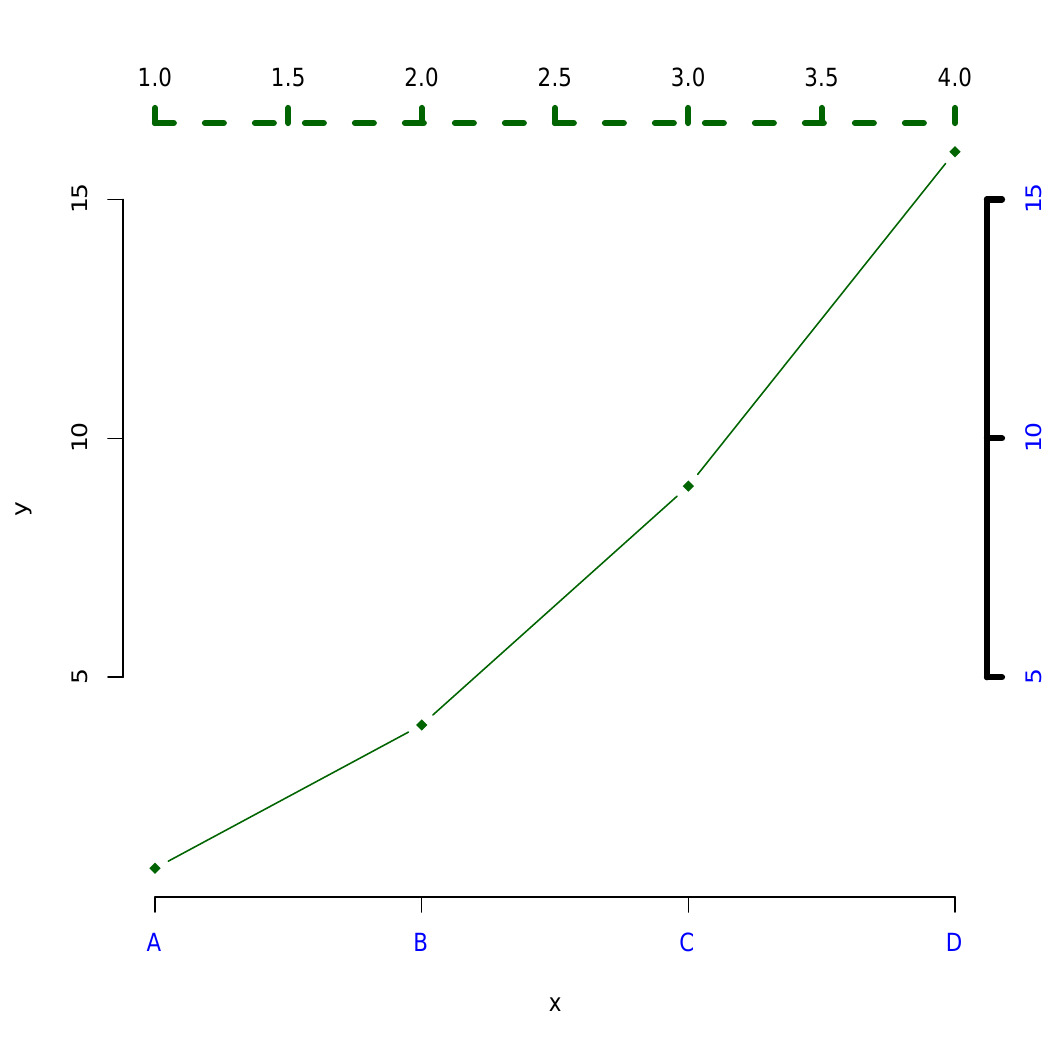
這裏繪製了不同類型的軸,實現了線寬(lwd)和線型(lty)的修改。
相關用法
- R語言 abline()用法及代碼示例
- R語言 points()用法及代碼示例
- R語言 lines()用法及代碼示例
- R語言 arrows()用法及代碼示例
- R語言 dgeom()用法及代碼示例
- R語言 pairs()用法及代碼示例
- R語言 plot()用法及代碼示例
- R語言 jitter()用法及代碼示例
- R語言 append()用法及代碼示例
- R語言 is.primitive()用法及代碼示例
注:本文由純淨天空篩選整理自kaurbal1698大神的英文原創作品 Adding axis to a Plot in R programming – axis () Function。非經特殊聲明,原始代碼版權歸原作者所有,本譯文未經允許或授權,請勿轉載或複製。
