用法:
RandomState.power(a, size=None)從具有正 index a-1的功率分布中以[0,1]抽取樣本。
也稱為冪函數分布。
參數: - a: : float 或 array_like of floats
分布參數。必須為非負數。
- size: : int 或 tuple of ints, 可選參數
輸出形狀。如果給定的形狀是
(m, n, k), 然後m * n * k抽取樣品。如果尺寸是None(默認),如果返回一個值a是標量。除此以外,np.array(a).size抽取樣品。
返回值: - out: : ndarray或標量
從參數化功率分布中抽取樣本。
異常: - ValueError:
如果<1。
注意:
概率密度函數為
冪函數分布隻是帕累托分布的倒數。它也可能被視為Beta分布的特例。
例如,它用於建模保險索賠的over-reporting。
參考文獻:
[1] 克裏斯蒂安·克萊伯(Christian Kleiber),塞繆爾·科茨(Samuel Kotz),“經濟學和精算科學中的統計規模分布”,威利,2003年。 [2] Heckert,N. A.和Filliben,James J.“ NIST手冊148:數據圖參考手冊,第2卷:讓子命令和庫函數”,美國國家標準技術研究所手冊 Series ,2003年6月。https://www.itl.nist.gov/div898/software/dataplot/refman2/auxillar/powpdf.pdf 例子:
從分布中抽取樣本:
>>> a = 5. # shape
>>> samples = 1000
>>> s = np.random.power(a, samples)
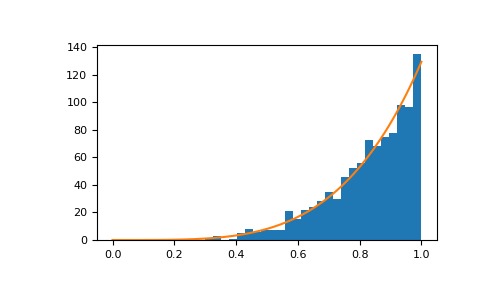
顯示樣本的直方圖以及概率密度函數:
>>> import matplotlib.pyplot as plt
>>> count, bins, ignored = plt.hist(s, bins=30)
>>> x = np.linspace(0, 1, 100)
>>> y = a*x**(a-1.)
>>> normed_y = samples*np.diff(bins)[0]*y
>>> plt.plot(x, normed_y)
>>> plt.show()
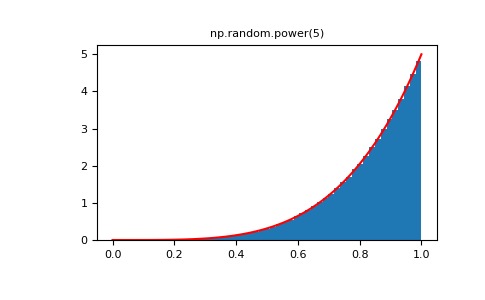
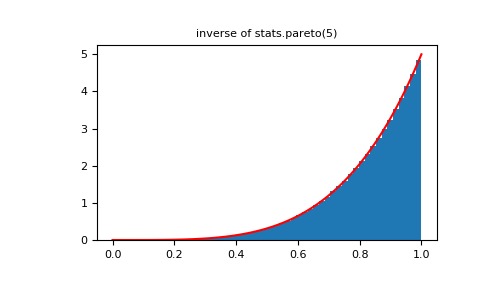
將冪函數分布與Pareto的倒數進行比較。
>>> from scipy import stats # doctest:+SKIP
>>> rvs = np.random.power(5, 1000000)
>>> rvsp = np.random.pareto(5, 1000000)
>>> xx = np.linspace(0,1,100)
>>> powpdf = stats.powerlaw.pdf(xx,5)  # doctest:+SKIP
>>> plt.figure() >>> plt.hist(rvs, bins=50, density=True) >>> plt.plot(xx,powpdf,'r-') # doctest:+SKIP >>> plt.title('np.random.power(5)')>>> plt.figure() >>> plt.hist(1./(1.+rvsp), bins=50, density=True) >>> plt.plot(xx,powpdf,'r-') # doctest:+SKIP >>> plt.title('inverse of 1 + np.random.pareto(5)')>>> plt.figure() >>> plt.hist(1./(1.+rvsp), bins=50, density=True) >>> plt.plot(xx,powpdf,'r-') # doctest:+SKIP >>> plt.title('inverse of stats.pareto(5)')


注:本文由純淨天空篩選整理自 numpy.random.mtrand.RandomState.power。非經特殊聲明,原始代碼版權歸原作者所有,本譯文未經允許或授權,請勿轉載或複製。
