關於:
numpy.logspace(開始,停止,num = 50,端點= True,基數= 10.0,dtype =無):以對數刻度平均間隔間隔返回數字間隔。
參數:
-> start    : [float] start(base ** start) of interval range.
-> stop     : [float] end(base ** stop) of interval range
-> endpoint : [boolean, optional]If True, stop is the last sample. By default, True
-> num      : [int, optional] No. of samples to generate
-> base     : [float, optional] Base of log scale. By default, equals 10.0
-> dtype    : type of output array
返回:
-> ndarray
代碼1:解釋logspace()的使用
# Python Programming illustrating
# numpy.logspace method

import numpy as geek

# base = 11
print("B\n", geek.logspace(2.0, 3.0, num=5, base = 11))

# base = 10
print("B\n", geek.logspace(2.0, 3.0, num=5))

# base = 10, dtype = int
print("B\n", geek.logspace(2.0, 3.0, num=5, dtype = int))
輸出:
B
 [  121.           220.36039471   401.31159963   730.8527479   1331.        ]
B
 [  100.           177.827941     316.22776602   562.34132519  1000.        ]
B
 [ 100  177  316  562 1000]
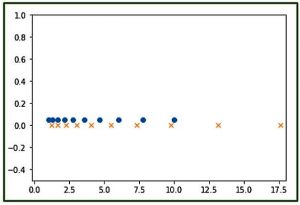
代碼2:使用matplotlib模塊的numpy.logspace()的圖形表示-pylab
# Graphical Represenation of numpy.logspace()
import numpy as geek
import pylab as p

# Start = 0
# End = 2
# Samples to generate = 10
x1 = geek.logspace(0, 1, 10)
y1 = geek.zeros(10)

# Start = 0.1
# End = 1.5
# Samples to generate = 12
x2 = geek.logspace(0.1, 1.5, 12)
y2 = geek.zeros(12)

p.plot(x1, y1+0.05, 'o')
p.xlim(-0.2, 18)
p.ylim(-0.5, 1)
p.plot(x2, y2, 'x')
輸出:

注意:
這些NumPy-Python程序不會在onlineID上運行,因此請在您的係統上運行它們以進行探索
相似方法:
相關用法
注:本文由純淨天空篩選整理自 numpy.logspace() in Python。非經特殊聲明,原始代碼版權歸原作者所有,本譯文未經允許或授權,請勿轉載或複製。
