關於:
numpy.linspace(開始,停止,num = 50,端點= True,retstep = False,dtype = None):以間隔間隔均勻地返回數字空間。與arange類似,但不使用step而是使用樣本編號。
參數:
-> start  : [optional] start of interval range. By default start = 0
-> stop   : end of interval range
-> restep : If True, return (samples, step). By deflut restep = False
-> num    : [int, optional] No. of samples to generate
-> dtype  : type of output array
返回:
-> ndarray
-> step : [float, optional], if restep = True
代碼1:解釋linspace函數
# Python Programming illustrating
# numpy.linspace method

import numpy as geek

# restep set to True
print("B\n", geek.linspace(2.0, 3.0, num=5, retstep=True), "\n")

# To evaluate sin() in long range
x = geek.linspace(0, 2, 10)
print("A\n", geek.sin(x))
輸出:
B
 (array([ 2.  ,  2.25,  2.5 ,  2.75,  3.  ]), 0.25)

A
 [ 0.          0.22039774  0.42995636  0.6183698   0.77637192  0.8961922
  0.9719379   0.99988386  0.9786557   0.90929743]
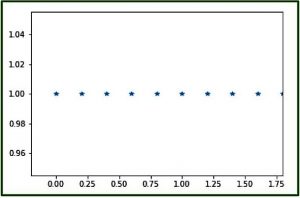
代碼2:使用matplotlib模塊的numpy.linspace()的圖形表示-pylab
# Graphical Represenation of numpy.linspace()
import numpy as geek
import pylab as p

# Start = 0
# End = 2
# Samples to generate = 10
x1 = geek.linspace(0, 2, 10, endpoint = False)
y1 = geek.ones(10)

p.plot(x1, y1, '*')
p.xlim(-0.2, 1.8)
輸出:

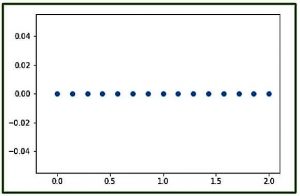
代碼3:使用pylab的numpy.linspace()的圖形表示
# Graphical Represenation of numpy.linspace()
import numpy as geek
import pylab as p

# Start = 0
# End = 2
# Samples to generate = 15
x1 = geek.linspace(0, 2, 15, endpoint = True)
y1 = geek.zeros(15)

p.plot(x1, y1, 'o')
p.xlim(-0.2, 2.1)
輸出:

注意:
這些NumPy-Python程序不會在onlineID上運行,因此請在您的係統上運行它們以進行探索
。
相關用法
注:本文由純淨天空篩選整理自 numpy.linspace() in Python。非經特殊聲明,原始代碼版權歸原作者所有,本譯文未經允許或授權,請勿轉載或複製。
