Matplotlib是Python中的一個庫,它是NumPy庫的數字-數學擴展。 Pyplot是Matplotlib模塊的基於狀態的接口,該模塊提供MATLAB-like接口。
matplotlib.pyplot.yscale() in Python
matplotlib.pyplot.yscale()函數在matplotlib庫的pyplot模塊中,用於設置y軸比例。
用法: matplotlib.pyplot.yscale(value, **kwargs)
參數:
值= {“linear”,“log”,“symlog”,“logit”,…}
這些是要應用的各種軸刻度。
** kwargs =接受不同的關鍵字參數,具體取決於比例尺(matplotlib.scale.LinearScale,LogScale,SymmetricalLogScale,LogitScale)
範例1:
Python3
import numpy as np
import pandas as pd
import matplotlib.pyplot as plt
import time
%matplotlib inline

# Example 1
y = np.random.randn(50)
y = y[(y > 0) & (y < 1)]
y.sort()
x = np.arange(len(y))

# plot with various axes scales
plt.figure()

# linear
plt.subplot(221)
plt.plot(x, y)
plt.yscale('linear')
plt.title('linear')
plt.grid(True)


# log
plt.subplot(222)
plt.plot(x, y)
plt.yscale('log')
plt.title('log')
plt.grid(True)


plt.show()
輸出:
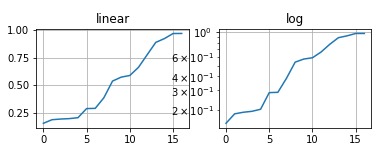
線性和對數的yscale圖
範例2:
Python3
import numpy as np
import pandas as pd
import matplotlib.pyplot as plt
import time
%matplotlib inline

# Example 2
# useful for `logit` scale
from matplotlib.ticker import NullFormatter

# Fixing random state for reproducibility
np.random.seed(100)

# make up some data in the
# interval ]0, 1[
y = np.random.normal(loc=0.5,
                     scale=0.4, size=1000)
y = y[(y > 0) & (y < 1)]
y.sort()
x = np.arange(len(y))

# plot with various axes scales
plt.figure()

# symmetric log
plt.subplot(221)
plt.plot(x, y - y.mean())
plt.yscale('symlog', linthreshy=0.01)
plt.title('symlog')
plt.grid(True)

# logit
plt.subplot(222)
plt.plot(x, y)
plt.yscale('logit')
plt.title('logit')
plt.grid(True)

plt.gca().yaxis.set_minor_formatter(NullFormatter())

# Adjust the subplot layout, because
# the logit one may take more space
# than usual, due to y-tick labels like "1 - 10^{-3}"
plt.subplots_adjust(top=0.80, bottom=0.03,
                    left=0.15, right=0.92,
                    hspace=0.34,wspace=0.45)

plt.show()
輸出:
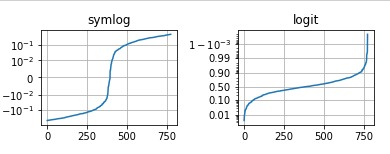
ylog圖用於loglog和logit
注:本文由純淨天空篩選整理自dhruv_tewari大神的英文原創作品 Matplotlib.pyplot.yscale() in Python。非經特殊聲明,原始代碼版權歸原作者所有,本譯文未經允許或授權,請勿轉載或複製。