Matplotlib是Python中的一個庫,它是數字的-NumPy庫的數學擴展。 Pyplot是Matplotlib模塊的基於狀態的接口,該模塊提供了MATLAB-like接口。
matplotlib.pyplot.ylim()函數
matplotlib庫的pyplot模塊中的ylim()函數用於獲取或設置當前軸的y-limits。
用法: matplotlib.pyplot.ylim(*args, **kwargs)
參數:此方法接受以下描述的參數:
- bottom:此參數用於將ylim設置為底部。
- top:此參數用於將ylim設置為top。
- **kwargs:此參數是文本屬性,用於控製標簽的外觀。
返回值:這將返回以下內容:
- 底部,頂部:這將返回新的y軸限製的元組。
以下示例說明了matplotlib.pyplot中的matplotlib.pyplot.ylim()函數:
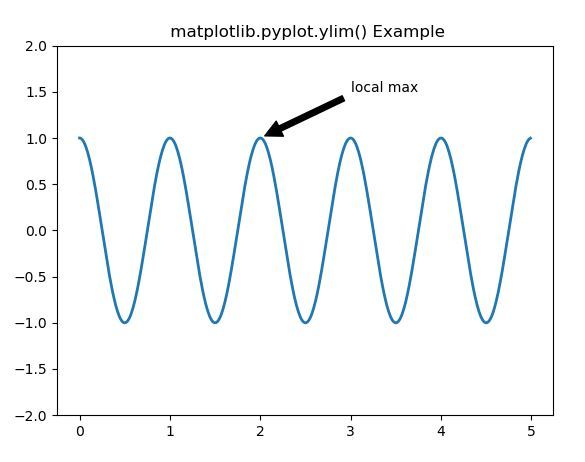
範例1:
# Implementation of matplotlib function
import matplotlib.pyplot as plt
import numpy as np

ax = plt.subplot(111)

t = np.arange(0.0, 5.0, 0.01)
s = np.cos(2 * np.pi * t)
line, = plt.plot(t, s, lw = 2)

plt.annotate('local max', xy =(2, 1),
             xytext =(3, 1.5),
             arrowprops = dict(facecolor ='black',
                               shrink = 0.05), )

plt.ylim(-2, 2)
plt.title(" matplotlib.pyplot.ylim() Example")
plt.show()
輸出:
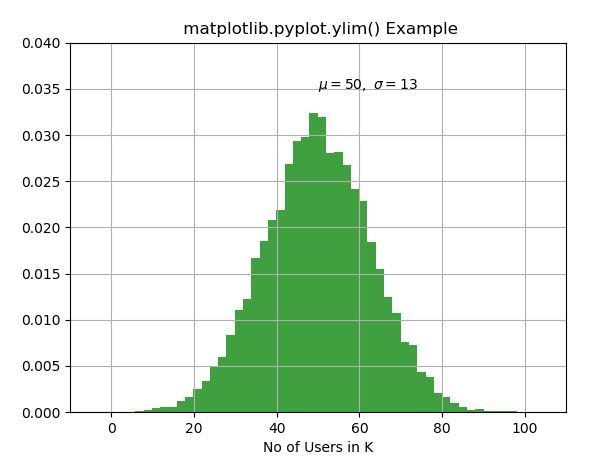
範例2:
# Implementation of matplotlib function
import matplotlib.pyplot as plt
import numpy as np

np.random.seed(9680801)

mu, sigma = 50, 13
x = mu + sigma * np.random.randn(10000)

# the histogram of the data
n, bins, patches = plt.hist(x, 50,
                            density = True,
                            facecolor ='g',
                            alpha = 0.75)


plt.xlabel('No of Users in K')
plt.title('Histogram of IQ')
plt.text(50, .035, r'$\mu = 50,\
\ \sigma = 13$')

plt.xlim(-10, 110)
plt.ylim(0, 0.04)

plt.grid(True)
plt.title(" matplotlib.pyplot.ylim() Example")

plt.show()
輸出:
相關用法
注:本文由純淨天空篩選整理自SHUBHAMSINGH10大神的英文原創作品 Matplotlib.pyplot.ylim() in Python。非經特殊聲明,原始代碼版權歸原作者所有,本譯文未經允許或授權,請勿轉載或複製。